\n
## Scatter Plot: Reasoning Tokens vs. Problem Size
### Overview
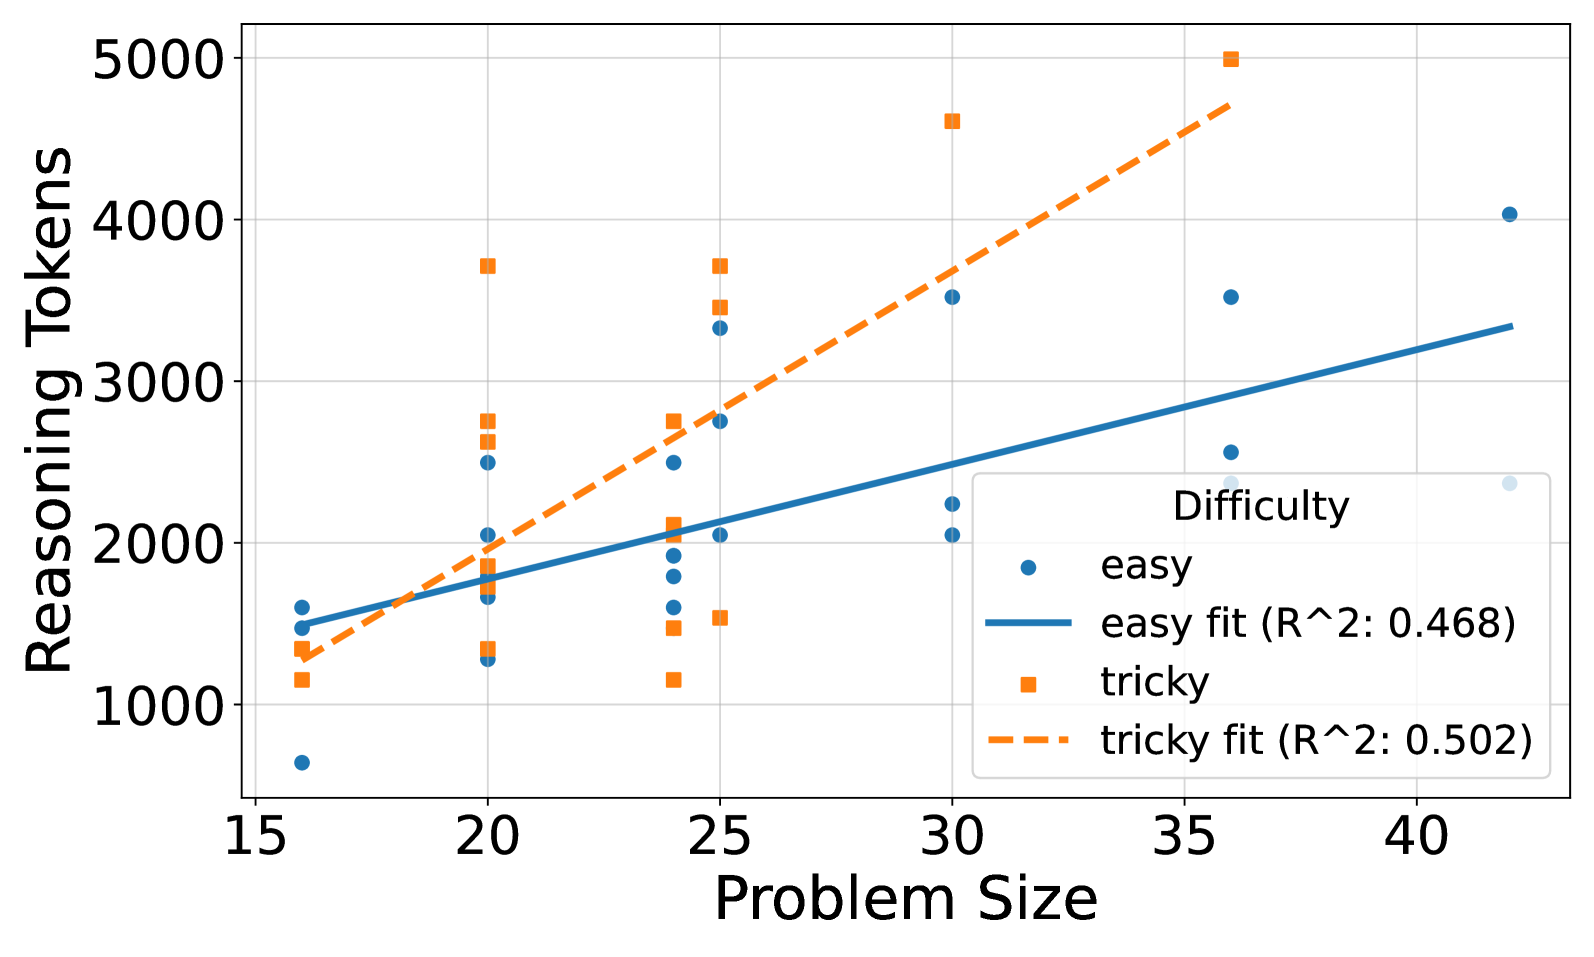
This image presents a scatter plot illustrating the relationship between "Problem Size" and "Reasoning Tokens" for two difficulty levels: "easy" and "tricky". Two linear regression lines are fitted to each dataset, showing the trend for each difficulty. The plot includes a legend identifying the data series and their corresponding R-squared values.
### Components/Axes
* **X-axis:** "Problem Size" ranging from approximately 15 to 42.
* **Y-axis:** "Reasoning Tokens" ranging from approximately 500 to 5000.
* **Legend:** Located in the top-right corner, it identifies:
* "easy" (blue circles) with a solid blue line labeled "easy fit (R^2: 0.468)"
* "tricky" (orange squares) with a dashed orange line labeled "tricky fit (R^2: 0.502)"
* **Grid:** A light gray grid is present to aid in reading values.
### Detailed Analysis
**Easy Data (Blue Circles):**
The "easy" data points are scattered, generally increasing with problem size. The fitted line slopes upward, indicating a positive correlation.
* At Problem Size ≈ 15, Reasoning Tokens ≈ 800.
* At Problem Size ≈ 20, Reasoning Tokens ≈ 1600.
* At Problem Size ≈ 25, Reasoning Tokens ≈ 2200.
* At Problem Size ≈ 30, Reasoning Tokens ≈ 2300.
* At Problem Size ≈ 35, Reasoning Tokens ≈ 2500.
* At Problem Size ≈ 40, Reasoning Tokens ≈ 3900.
**Tricky Data (Orange Squares):**
The "tricky" data points are also scattered, but generally show a stronger upward trend than the "easy" data. The fitted line is steeper, indicating a stronger positive correlation.
* At Problem Size ≈ 16, Reasoning Tokens ≈ 1500.
* At Problem Size ≈ 20, Reasoning Tokens ≈ 2500.
* At Problem Size ≈ 25, Reasoning Tokens ≈ 3500.
* At Problem Size ≈ 30, Reasoning Tokens ≈ 4500.
* At Problem Size ≈ 35, Reasoning Tokens ≈ 4800.
* At Problem Size ≈ 40, Reasoning Tokens ≈ 5000.
### Key Observations
* The "tricky" problems consistently require more reasoning tokens than "easy" problems for the same problem size.
* The R-squared value for the "tricky" fit (0.502) is slightly higher than for the "easy" fit (0.468), suggesting a better linear fit for the "tricky" data.
* Both datasets exhibit considerable scatter, indicating that problem size is not the sole determinant of reasoning tokens.
* There is a noticeable gap between the two lines, especially at larger problem sizes.
### Interpretation
The data suggests that the complexity of a problem (as indicated by "difficulty") significantly impacts the number of reasoning tokens required to solve it. As problem size increases, the number of reasoning tokens also tends to increase, but this relationship is not perfectly linear. The higher R-squared value for the "tricky" data suggests that the relationship between problem size and reasoning tokens is more predictable for complex problems. The scatter in both datasets indicates that other factors, beyond problem size and difficulty, influence the reasoning process. The increasing gap between the two lines as problem size grows suggests that the difference in reasoning effort between "easy" and "tricky" problems becomes more pronounced with larger problem sizes. This could be due to the increased need for more complex strategies or deeper reasoning when tackling larger, more challenging problems.