## Scatter Plot: Relationship Between Problem Size and Reasoning Tokens
### Overview
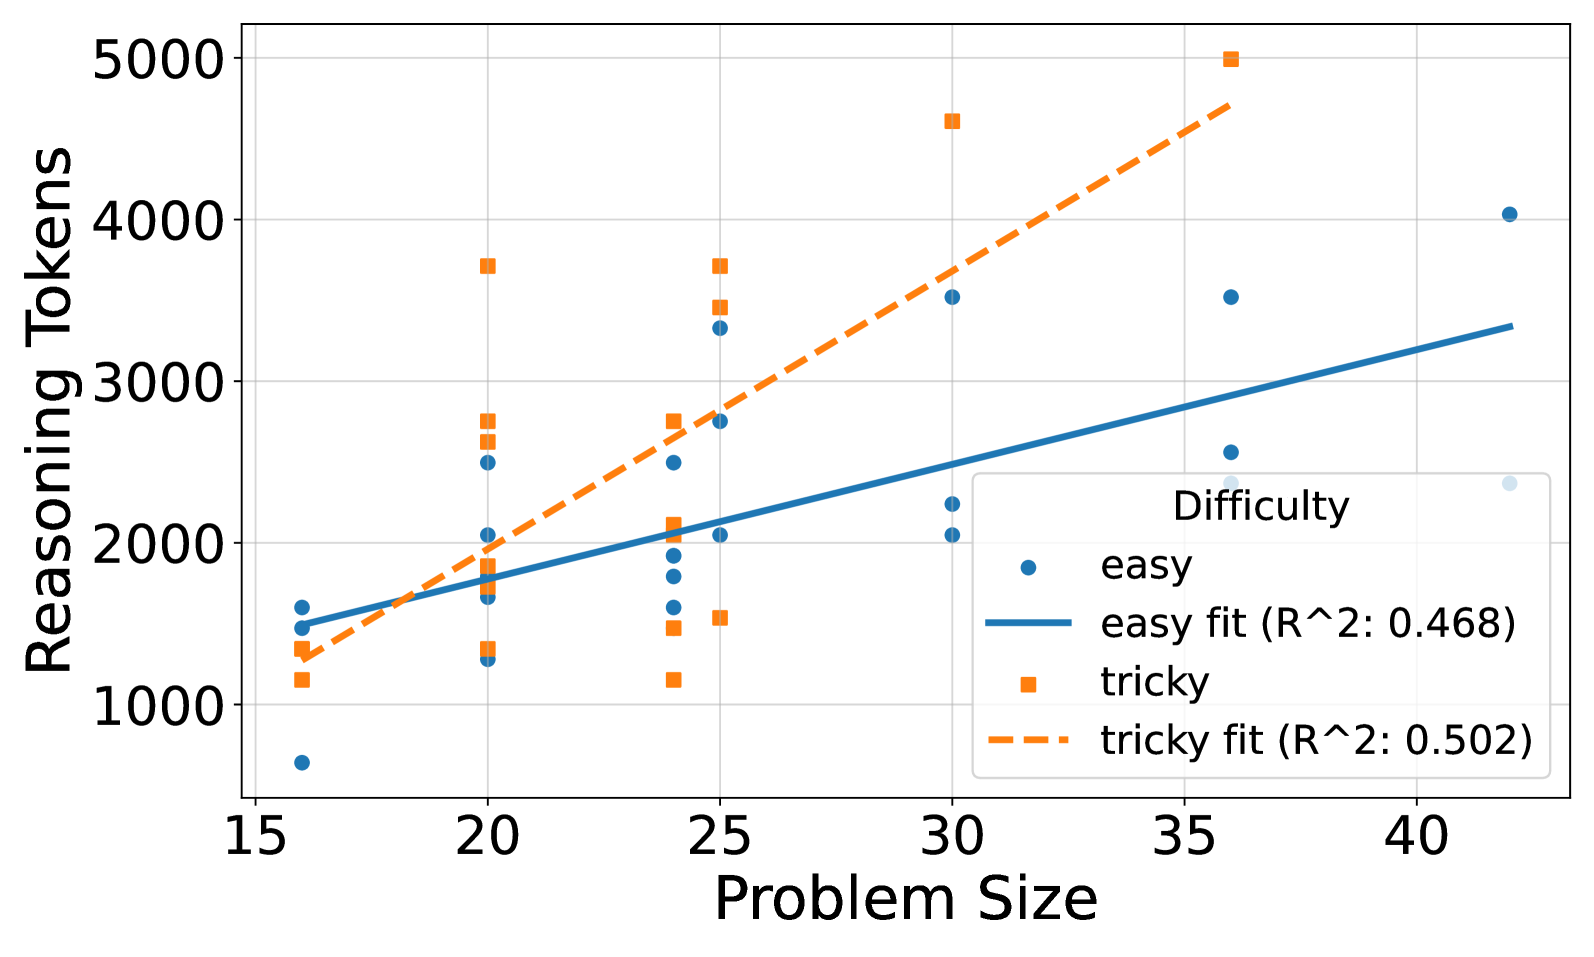
The image is a scatter plot comparing "Reasoning Tokens" (y-axis) against "Problem Size" (x-axis) for two difficulty levels: "easy" and "tricky." Two trend lines (solid blue for "easy" and dashed orange for "tricky") are overlaid, with R² values indicating model fit. The legend is positioned in the bottom-right corner.
### Components/Axes
- **X-axis (Problem Size)**: Ranges from 15 to 40, with increments of 5.
- **Y-axis (Reasoning Tokens)**: Ranges from 0 to 5000, with increments of 1000.
- **Legend**:
- **Blue circles**: "easy" data points.
- **Orange squares**: "tricky" data points.
- **Solid blue line**: "easy" trend line (R²: 0.468).
- **Dashed orange line**: "tricky" trend line (R²: 0.502).
### Detailed Analysis
- **Data Points**:
- **Easy (blue circles)**:
- Clustered around the trend line, with some spread.
- Example values:
- Problem Size 15: ~1500 tokens.
- Problem Size 20: ~1800 tokens.
- Problem Size 30: ~2500 tokens.
- Problem Size 40: ~4000 tokens.
- **Tricky (orange squares)**:
- More dispersed, with higher variability.
- Example values:
- Problem Size 20: ~1200 tokens.
- Problem Size 25: ~2800 tokens.
- Problem Size 30: ~4500 tokens.
- Problem Size 35: ~5000 tokens.
- **Trend Lines**:
- **Easy**: Slightly upward slope, starting near 1500 tokens at Problem Size 15 and reaching ~3500 at 40.
- **Tricky**: Steeper upward slope, starting near 1200 tokens at Problem Size 15 and reaching ~5000 at 35.
### Key Observations
1. **Trend Correlation**:
- Both "easy" and "tricky" show positive correlations between Problem Size and Reasoning Tokens.
- "Tricky" has a higher R² (0.502 vs. 0.468), suggesting a stronger linear relationship.
2. **Outliers/Anomalies**:
- A single "tricky" data point at Problem Size 35 (5000 tokens) appears as an outlier, far above the trend line.
- "Easy" data points at Problem Size 40 (~4000 tokens) deviate slightly from the trend line.
3. **Variability**:
- "Tricky" data points exhibit greater spread, indicating higher inconsistency in reasoning token usage.
- "Easy" data points are more tightly clustered around the trend line.
### Interpretation
The data suggests that **Problem Size directly influences Reasoning Tokens**, with "tricky" problems requiring significantly more tokens than "easy" ones. The higher R² for "tricky" implies the model fits this data better, but the spread in "easy" data points may reflect variability in how "easy" problems are processed. The outlier at Problem Size 35 for "tricky" could indicate an exceptional case or a data entry error. The steeper slope for "tricky" highlights that complexity amplifies token usage, while the "easy" trend line’s gentler slope suggests more predictable resource allocation.