## Scatter Plot: Music Genre Distribution in Principal Component Space
### Overview
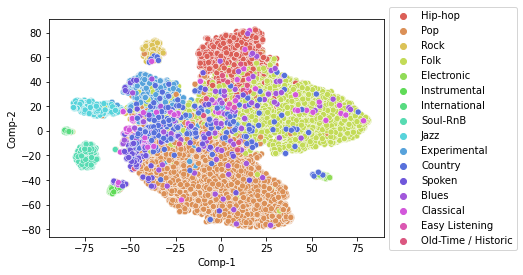
The image is a 2D scatter plot visualizing the distribution of music genres across two principal components (Comp-1 and Comp-2). Data points are color-coded by genre, with 15 distinct categories represented. The plot reveals clear clustering patterns, suggesting that genres with similar acoustic or stylistic features occupy proximate regions in the reduced-dimensional space.
### Components/Axes
- **X-axis (Comp-1)**: Ranges from -75 to 75
- **Y-axis (Comp-2)**: Ranges from -80 to 80
- **Legend**: Located in the top-right corner, mapping 15 genres to colors:
- Red: Hip-hop
- Orange: Pop
- Yellow: Rock
- Light Green: Folk
- Dark Green: Electronic
- Teal: Instrumental
- Light Blue: International
- Dark Blue: Soul/RnB
- Purple: Jazz
- Cyan: Experimental
- Navy: Country
- Magenta: Spoken
- Pink: Blues
- Light Pink: Classical
- Dark Pink: Easy Listening
- Brown: Old-Time/Historic
### Detailed Analysis
1. **Hip-hop (Red)**: Dense cluster in the top-right quadrant (Comp-1: 50-75, Comp-2: 40-80). High density suggests strong shared features.
2. **Pop (Orange)**: Large cluster in the bottom-right quadrant (Comp-1: 25-50, Comp-2: -40 to 0). Moderate spread indicates genre diversity.
3. **Rock (Yellow)**: Top-center cluster (Comp-1: 0-25, Comp-2: 40-60). Distinct from Hip-hop but adjacent.
4. **Folk (Light Green)**: Small cluster in top-left (Comp-1: -25 to 0, Comp-2: 40-60). Isolated from other genres.
5. **Electronic (Dark Green)**: Scattered points in top-right, overlapping with Hip-hop but less dense.
6. **Instrumental (Teal)**: Small cluster in bottom-left (Comp-1: -50 to -25, Comp-2: -40 to -20).
7. **International (Light Blue)**: Scattered points in bottom-left, overlapping with Instrumental.
8. **Soul/RnB (Dark Blue)**: Cluster in bottom-center (Comp-1: -25 to 0, Comp-2: -40 to -20).
9. **Jazz (Purple)**: Scattered points in top-center, overlapping with Rock.
10. **Experimental (Cyan)**: Small cluster in bottom-left (Comp-1: -50 to -25, Comp-2: -60 to -40).
11. **Country (Navy)**: Cluster in bottom-right (Comp-1: 0-25, Comp-2: -60 to -40), adjacent to Pop.
12. **Spoken (Magenta)**: Scattered points in top-center, overlapping with Rock/Jazz.
13. **Blues (Pink)**: Small cluster in top-center (Comp-1: 0-25, Comp-2: 40-60), near Rock.
14. **Classical (Light Pink)**: Scattered points in top-right, overlapping with Hip-hop/Electronic.
15. **Easy Listening (Dark Pink)**: Small cluster in top-center (Comp-1: 0-25, Comp-2: 40-60), near Rock/Blues.
16. **Old-Time/Historic (Brown)**: Small cluster in top-left (Comp-1: -25 to 0, Comp-2: 40-60), near Folk.
### Key Observations
- **Genre Separation**: Most genres form distinct clusters, with minimal overlap (e.g., Hip-hop vs. Electronic).
- **Density Variance**: Hip-hop and Pop show the highest point density, suggesting stronger shared characteristics.
- **Outliers**: Jazz and Spoken genres show scattered points, indicating greater stylistic diversity.
- **Component Influence**: Comp-1 separates genres along a "rhythm-intensity" axis (Hip-hop/Pop on the right vs. Instrumental/Experimental on the left). Comp-2 separates "melodic complexity" (top: Hip-hop/Rock vs. bottom: Country/Experimental).
### Interpretation
The plot demonstrates that music genres occupy distinct regions in a 2D feature space derived from principal component analysis. The clear clustering suggests that acoustic features (e.g., tempo, instrumentation, harmonic structure) effectively differentiate genres. However, the scattered points for Jazz, Spoken, and Experimental indicate these genres may encompass broader stylistic ranges or hybrid forms. The proximity of Hip-hop and Electronic clusters implies shared rhythmic or production characteristics, while the isolation of Folk and Old-Time/Historic suggests unique acoustic signatures. This visualization could inform music recommendation systems by identifying genre adjacencies or help researchers analyze stylistic evolution across categories.