## Chart: Separation between true and false statements across layers
### Overview
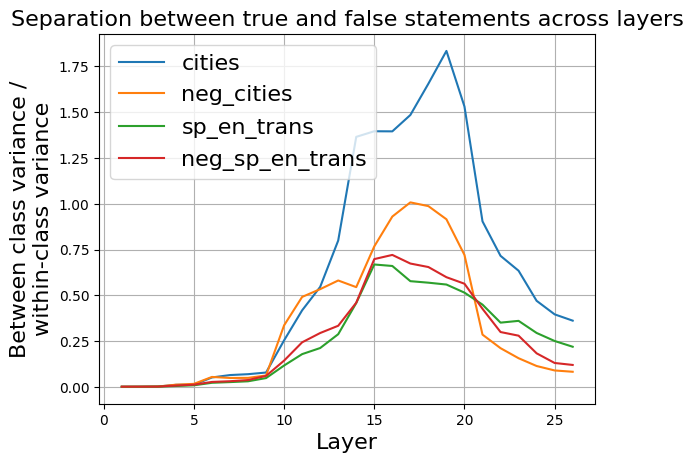
The image is a line chart that shows the separation between true and false statements across different layers. The y-axis represents the "Between class variance / within-class variance", and the x-axis represents the "Layer". There are four data series plotted on the chart, each representing a different category: "cities", "neg_cities", "sp_en_trans", and "neg_sp_en_trans". The chart illustrates how the separation between true and false statements varies across the layers for each category.
### Components/Axes
* **Title:** Separation between true and false statements across layers
* **X-axis:**
* Label: Layer
* Scale: 0 to 25, with tick marks at intervals of 5.
* **Y-axis:**
* Label: Between class variance / within-class variance
* Scale: 0.00 to 1.75, with tick marks at intervals of 0.25.
* **Legend:** Located in the top-left corner of the chart.
* cities (dark blue line)
* neg\_cities (orange line)
* sp\_en\_trans (green line)
* neg\_sp\_en\_trans (brown line)
### Detailed Analysis
* **cities (dark blue line):** The line starts at approximately 0.00 at layer 0, remains near 0 until layer 8, then increases sharply to approximately 1.4 at layer 15, continues to increase to a peak of approximately 1.8 at layer 20, and then decreases to approximately 0.4 at layer 26.
* **neg\_cities (orange line):** The line starts at approximately 0.00 at layer 0, remains near 0 until layer 8, then increases to approximately 1.0 at layer 18, and then decreases to approximately 0.1 at layer 26.
* **sp\_en\_trans (green line):** The line starts at approximately 0.00 at layer 0, remains near 0 until layer 8, then increases to approximately 0.7 at layer 16, and then decreases to approximately 0.2 at layer 26.
* **neg\_sp\_en\_trans (brown line):** The line starts at approximately 0.00 at layer 0, remains near 0 until layer 8, then increases to approximately 0.75 at layer 16, and then decreases to approximately 0.1 at layer 26.
### Key Observations
* The "cities" category shows the highest separation between true and false statements, with a peak at layer 20.
* All categories show a similar trend: a sharp increase in separation between layers 8 and 20, followed by a decrease.
* The "neg\_cities", "sp\_en\_trans", and "neg\_sp\_en\_trans" categories have similar separation values, with "neg\_cities" being slightly higher than the other two.
* The separation between true and false statements is minimal for all categories in the initial layers (0-8).
### Interpretation
The chart suggests that the separation between true and false statements varies significantly across different layers of the model. The "cities" category exhibits the most pronounced separation, indicating that the model is better at distinguishing between true and false statements for this category compared to the others. The peak separation around layer 20 suggests that this layer is particularly important for distinguishing between true and false statements. The similar trends observed across all categories indicate a common pattern in how the model processes information across layers. The minimal separation in the initial layers suggests that these layers may be involved in more general feature extraction, while the later layers are more specialized for distinguishing between true and false statements.