## Line Graph: Separation between true and false statements across layers
### Overview
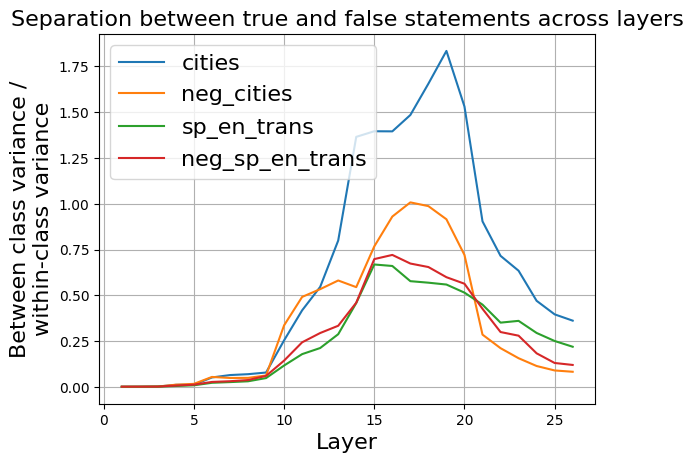
The image depicts a line graph comparing the separation between true and false statements across 25 layers of a model. Four distinct data series are plotted, each representing different categories: "cities" (blue), "neg_cities" (orange), "sp_en_trans" (green), and "neg_sp_en_trans" (red). The y-axis measures the ratio of between-class variance to within-class variance, while the x-axis represents layer numbers from 0 to 25.
### Components/Axes
- **X-axis (Layer)**: Ranges from 0 to 25 in increments of 5.
- **Y-axis (Between class variance / within-class variance)**: Scaled from 0.00 to 1.75 in increments of 0.25.
- **Legend**: Located in the top-left corner, with four entries:
- Blue: cities
- Orange: neg_cities
- Green: sp_en_trans
- Red: neg_sp_en_trans
- **Lines**: Four colored lines corresponding to the legend labels.
### Detailed Analysis
1. **cities (Blue Line)**:
- Starts near 0.00 at layer 0.
- Rises sharply, peaking at ~1.75 between layers 15–20.
- Declines gradually after layer 20, ending at ~0.40 at layer 25.
- **Peak**: ~1.75 (layer 18).
2. **neg_cities (Orange Line)**:
- Begins near 0.00 at layer 0.
- Increases gradually, peaking at ~1.00 between layers 15–17.
- Declines steeply after layer 17, ending at ~0.10 at layer 25.
- **Peak**: ~1.00 (layer 16).
3. **sp_en_trans (Green Line)**:
- Starts near 0.00 at layer 0.
- Rises moderately, peaking at ~0.70 between layers 15–17.
- Declines after layer 17, ending at ~0.20 at layer 25.
- **Peak**: ~0.70 (layer 16).
4. **neg_sp_en_trans (Red Line)**:
- Begins near 0.00 at layer 0.
- Increases gradually, peaking at ~0.70 between layers 15–17.
- Declines after layer 17, ending at ~0.15 at layer 25.
- **Peak**: ~0.70 (layer 17).
### Key Observations
- The **cities** line exhibits the highest variance separation, peaking sharply at layer 18.
- **neg_cities** and **sp_en_trans** lines show similar peak magnitudes (~1.00 and ~0.70, respectively) but at slightly earlier layers.
- **neg_sp_en_trans** mirrors **sp_en_trans** but with a marginally later peak and slower decline.
- All lines converge near 0.00 at layer 0 and diverge significantly after layer 10.
### Interpretation
The data suggests that layers 15–20 are critical for distinguishing true/false statements, with the "cities" category showing the strongest separation. The "neg_" prefixed categories (neg_cities, neg_sp_en_trans) exhibit lower separation, potentially indicating reduced discriminative power or inverse relationships. The green and red lines (sp_en_trans and neg_sp_en_trans) demonstrate near-identical trends, implying a symmetrical relationship between these categories. The sharp decline after layer 20 for all lines may reflect model saturation or diminishing returns in later layers.