\n
## Bar Chart: AutoRace Metric Comparison Across Methods and Datasets
### Overview
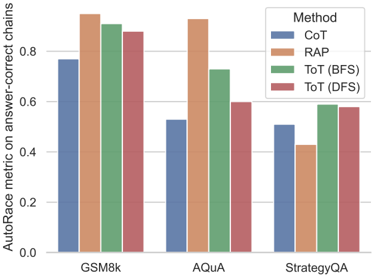
This bar chart compares the performance of four different methods (CoT, RAP, ToT (BFS), and ToT (DFS)) on three datasets (GSM8k, AquaQA, and StrategyQA) using the AutoRace metric for answer-correct chains. The chart displays the AutoRace metric score on the y-axis and the datasets on the x-axis, with each dataset having four bars representing the performance of each method.
### Components/Axes
* **X-axis:** Datasets - GSM8k, AquaQA, StrategyQA
* **Y-axis:** AutoRace metric on answer-correct chains (Scale from 0.0 to 1.0, increments of 0.2)
* **Legend (Top-right):**
* CoT (Blue)
* RAP (Orange)
* ToT (BFS) (Green)
* ToT (DFS) (Red)
### Detailed Analysis
**GSM8k Dataset:**
* **CoT (Blue):** Approximately 0.76.
* **RAP (Orange):** Approximately 0.93. This is the highest value for this dataset.
* **ToT (BFS) (Green):** Approximately 0.91.
* **ToT (DFS) (Red):** Approximately 0.89.
**AquaQA Dataset:**
* **CoT (Blue):** Approximately 0.54.
* **RAP (Orange):** Approximately 0.94. This is the highest value for this dataset.
* **ToT (BFS) (Green):** Approximately 0.72.
* **ToT (DFS) (Red):** Approximately 0.58.
**StrategyQA Dataset:**
* **CoT (Blue):** Approximately 0.44.
* **RAP (Orange):** Approximately 0.62.
* **ToT (BFS) (Green):** Approximately 0.59.
* **ToT (DFS) (Red):** Approximately 0.56.
**Trends:**
* For all three datasets, RAP consistently outperforms the other methods, achieving the highest AutoRace metric scores.
* CoT generally performs the worst across all datasets.
* ToT (BFS) and ToT (DFS) show similar performance, with ToT (BFS) slightly outperforming ToT (DFS) in GSM8k and AquaQA, but performing similarly in StrategyQA.
### Key Observations
* RAP demonstrates a significant advantage over other methods across all datasets.
* The performance gap between RAP and other methods is particularly noticeable in GSM8k and AquaQA.
* The performance of all methods is relatively lower on the StrategyQA dataset compared to GSM8k and AquaQA.
### Interpretation
The data suggests that the RAP method is the most effective for improving answer-correct chains based on the AutoRace metric across the tested datasets. The consistent outperformance of RAP indicates its robustness and suitability for various question-answering tasks. The lower performance on StrategyQA might indicate that this dataset presents unique challenges that are not effectively addressed by any of the tested methods, or that the AutoRace metric is less sensitive to improvements on this specific dataset. The differences between ToT (BFS) and ToT (DFS) are relatively small, suggesting that the search strategy (BFS vs. DFS) has a limited impact on performance in this context. The consistently lower performance of CoT suggests that it may not be as effective as other methods for generating answer-correct chains. The chart provides a clear comparison of the strengths and weaknesses of each method, allowing for informed decisions about which method to use for a given task.