## Histograms: Conductance Distributions Across Experimental Conditions
### Overview
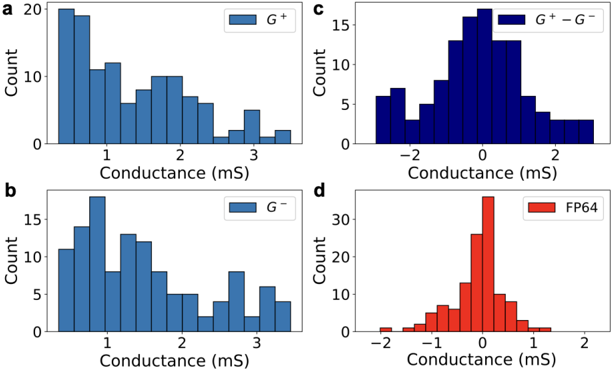
The image contains four histograms (a-d) comparing conductance distributions (in mS) across different experimental conditions. Each panel uses a distinct color-coded legend to represent data series, with counts on the y-axis and conductance values on the x-axis.
### Components/Axes
- **X-axis**: Conductance (mS) for all panels, with approximate ranges:
- Panels a/b: 0–3 mS
- Panels c/d: -2–2 mS
- **Y-axis**: Count (frequency) for all panels, with approximate maximums:
- Panels a/b: 0–20
- Panels c/d: 0–30
- **Legends**:
- Panel a: Blue = G⁺
- Panel b: Blue = G⁻
- Panel c: Blue = G⁺ − G⁻
- Panel d: Red = FP64
- **Spatial Grounding**:
- Legends positioned in the top-right corner of each panel.
- Axis labels centered below (x-axis) and above (y-axis) the respective axes.
### Detailed Analysis
#### Panel a (G⁺)
- **Distribution**: Right-skewed with a peak at ~0.5 mS (count ~20).
- **Trend**: Gradual decline in counts for conductance >1.5 mS.
- **Notable**: No negative conductance values observed.
#### Panel b (G⁻)
- **Distribution**: Bimodal with peaks at ~1.0 mS (count ~15) and ~2.5 mS (count ~10).
- **Trend**: Lower counts at 0–0.5 mS compared to G⁺.
- **Notable**: Broader spread than G⁺, suggesting higher variability.
#### Panel c (G⁺ − G⁻)
- **Distribution**: Symmetric around 0 mS, with a peak at ~0 mS (count ~15).
- **Trend**: Sharp decline in counts for |conductance| >1.0 mS.
- **Notable**: Negative values present, indicating directional differences between G⁺ and G⁻.
#### Panel d (FP64)
- **Distribution**: Narrower and sharper peak at ~0.5 mS (count ~25).
- **Trend**: Symmetric but less spread than G⁺ − G⁻.
- **Notable**: Higher peak count than G⁺ − G⁻, suggesting concentrated conductance values.
### Key Observations
1. **G⁺ vs. G⁻**: G⁺ shows lower conductance values with a single peak, while G⁻ exhibits bimodal distribution, indicating distinct physiological states.
2. **G⁺ − G⁻**: The difference histogram highlights directional conductance changes, with symmetry suggesting balanced opposing effects.
3. **FP64**: The red histogram (FP64) shows a tighter distribution than G⁺ − G⁻, possibly reflecting a controlled or standardized condition.
### Interpretation
- **Biological Implications**: The bimodal G⁻ distribution (panel b) may reflect subpopulations or dynamic conductance changes under specific stimuli. The symmetry in G⁺ − G⁻ (panel c) suggests antagonistic effects between G⁺ and G⁻ pathways.
- **FP64 Significance**: The FP64 histogram (panel d) could represent a filtered or optimized dataset, with reduced variability compared to raw G⁺ − G⁻ data.
- **Outliers**: The G⁻ peak at 2.5 mS (panel b) may indicate rare but significant conductance events requiring further investigation.
This analysis underscores the importance of distinguishing conductance dynamics across experimental conditions, with potential applications in understanding ion channel behavior or pharmacological responses.