## 3D Scatter Plot: Token Embeddings
### Overview
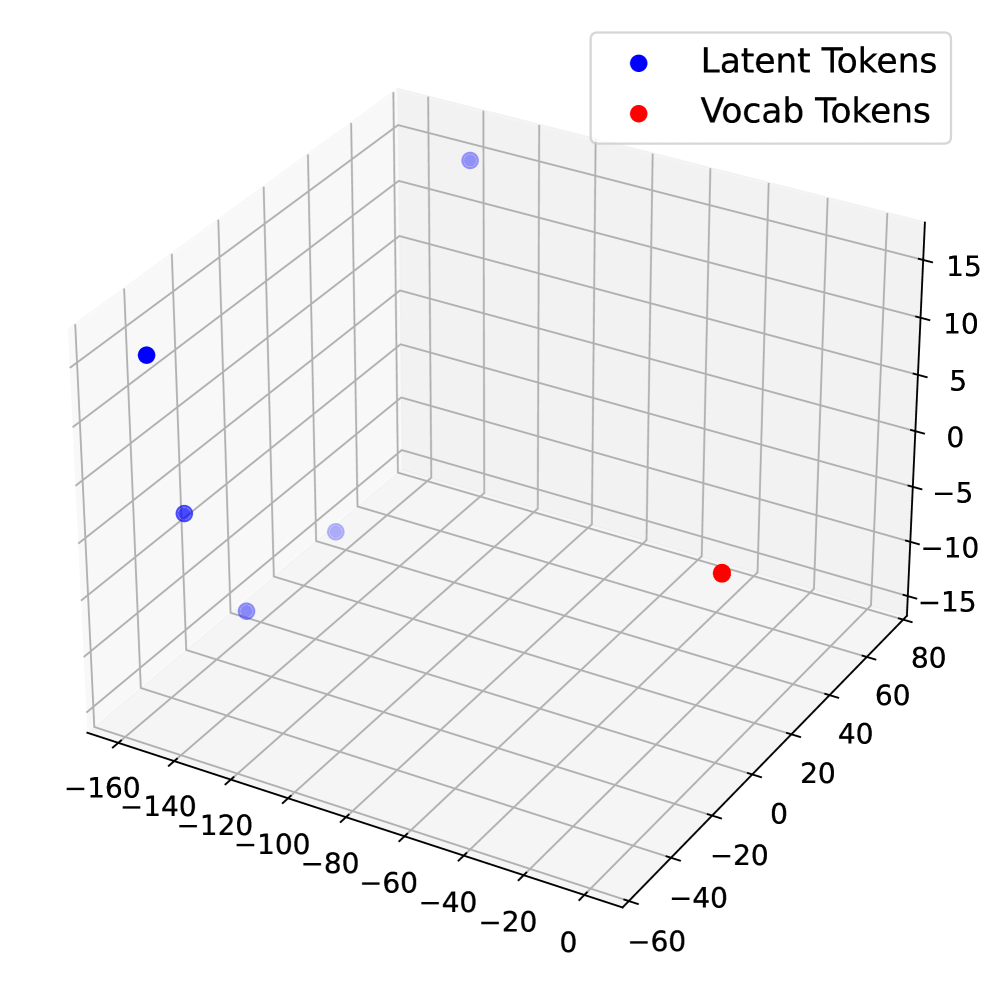
The image is a 3D scatter plot visualizing the distribution of two types of tokens: "Latent Tokens" (represented by blue dots) and "Vocab Tokens" (represented by a red dot). The plot shows the spatial arrangement of these tokens in a three-dimensional space.
### Components/Axes
* **X-axis:** Ranges from approximately -160 to 0.
* **Y-axis:** Ranges from approximately -60 to 80.
* **Z-axis:** Ranges from approximately -15 to 15.
* **Legend (Top-Right):**
* Blue dot: "Latent Tokens"
* Red dot: "Vocab Tokens"
### Detailed Analysis
* **Latent Tokens (Blue):** There are four blue data points, indicating four latent tokens.
* Token 1: Located at approximately (-160, 70, 10).
* Token 2: Located at approximately (-140, 0, 0).
* Token 3: Located at approximately (-120, 0, -5).
* Token 4: Located at approximately (-80, 0, 10).
* **Vocab Tokens (Red):** There is one red data point, indicating one vocab token.
* Token 1: Located at approximately (-20, 0, -12).
### Key Observations
* The latent tokens are clustered on the left side of the plot (negative X values), while the vocab token is located on the right side (near X=0).
* The latent tokens have varying Z values, while the vocab token has a negative Z value.
* The latent tokens are spread out, while the vocab token is isolated.
### Interpretation
The 3D scatter plot visualizes the embeddings of "Latent Tokens" and "Vocab Tokens" in a three-dimensional space. The spatial separation between the two groups of tokens suggests that they have distinct semantic or contextual meanings. The clustering of latent tokens on one side and the isolated position of the vocab token indicate that the latent tokens share some common features that differentiate them from the vocab token. The plot could be used to analyze the relationships between different types of tokens in a language model or other natural language processing application.