\n
## 3D Scatter Plot: Latent vs. Vocab Tokens
### Overview
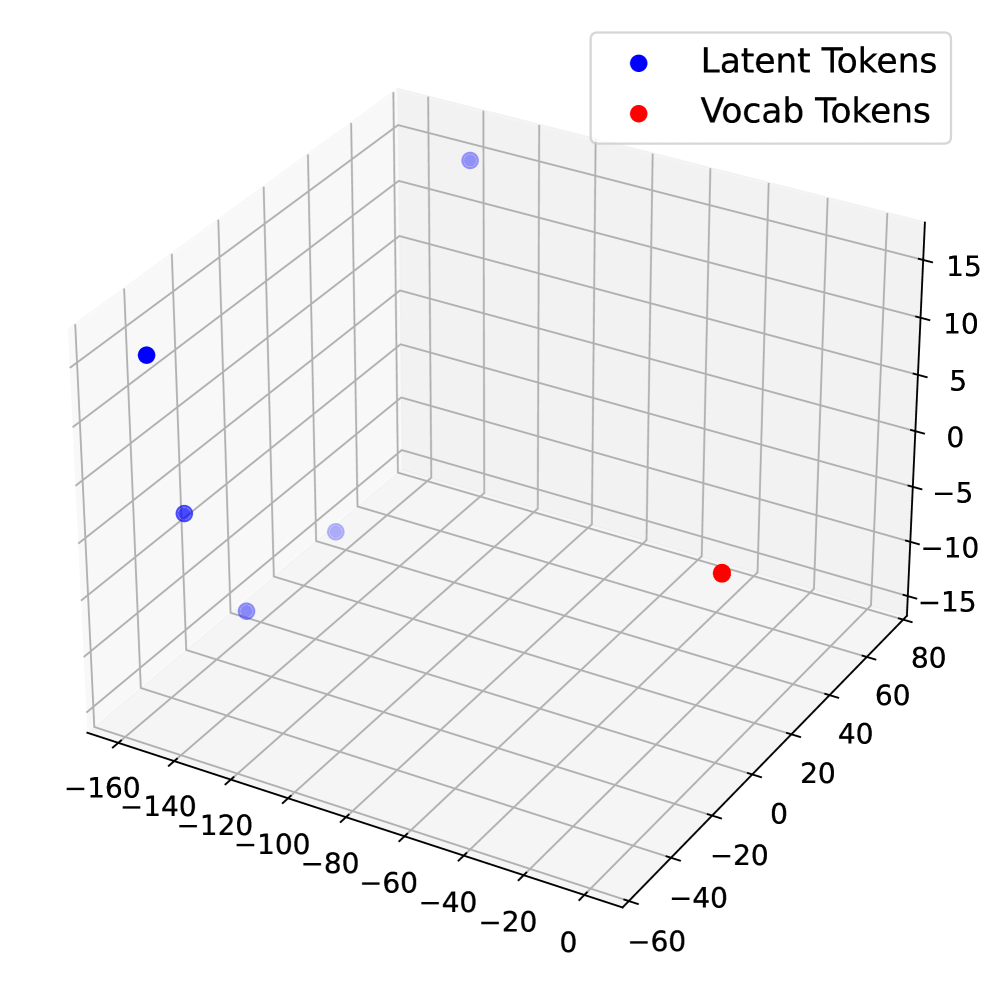
The image presents a 3D scatter plot visualizing the distribution of "Latent Tokens" and "Vocab Tokens" in a three-dimensional space. The plot uses blue spheres to represent Latent Tokens and red spheres to represent Vocab Tokens. The axes are not explicitly labeled with variable names, but are numerical scales.
### Components/Axes
* **X-axis:** Ranges approximately from -160 to 120.
* **Y-axis:** Ranges approximately from -60 to 80.
* **Z-axis:** Ranges approximately from -15 to 15.
* **Legend:** Located in the top-right corner.
* Blue sphere: "Latent Tokens"
* Red sphere: "Vocab Tokens"
### Detailed Analysis
The plot contains a small number of data points. Let's analyze each series:
**Latent Tokens (Blue Spheres):**
There are four blue spheres representing Latent Tokens.
* Point 1: Approximately (-140, 10, 12).
* Point 2: Approximately (-100, -40, -5).
* Point 3: Approximately (-100, 60, -10).
* Point 4: Approximately (-40, 40, 5).
**Vocab Tokens (Red Spheres):**
There is one red sphere representing Vocab Tokens.
* Point 1: Approximately (20, -60, -12).
### Key Observations
* The Latent Tokens are distributed across a wider range of the x and y axes compared to the Vocab Tokens.
* The Vocab Tokens are clustered in the negative y and z regions.
* There is a clear separation between the Latent Tokens and the Vocab Tokens in the 3D space.
* The number of Latent Tokens is significantly higher than the number of Vocab Tokens.
### Interpretation
The plot suggests a distinction between Latent Tokens and Vocab Tokens based on their distribution in this three-dimensional space. The separation indicates that these two types of tokens are represented differently in the underlying feature space. The wider distribution of Latent Tokens might imply greater diversity or variability within that token set. The single Vocab Token being located in a distinct region could indicate it represents an outlier or a unique characteristic within the vocabulary.
Without knowing what the axes represent, it's difficult to provide a more specific interpretation. However, the visualization suggests that the two token types are not interchangeable and have different properties as captured by the three dimensions. The plot could be used to explore relationships between these tokens and potentially identify patterns or anomalies in the data.