## 3D Scatter Plot: Latent vs. Vocab Token Embeddings
### Overview
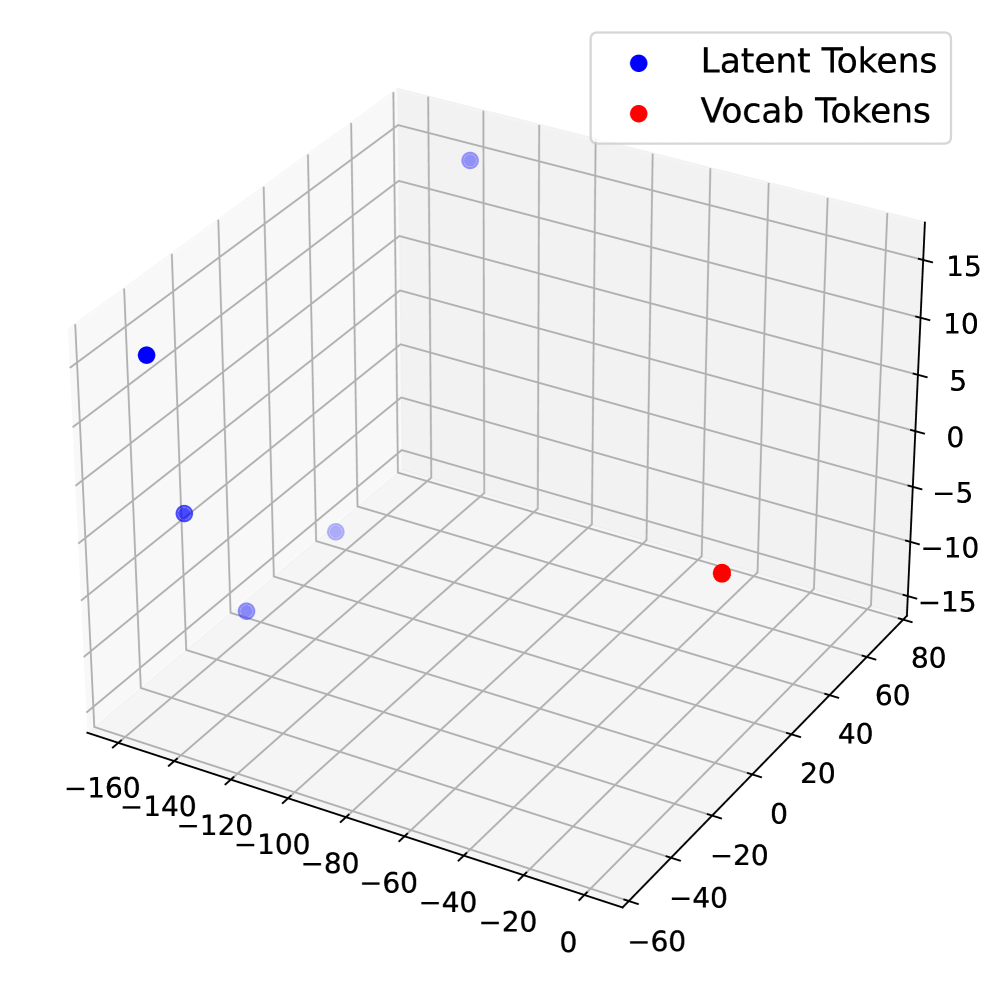
The image is a 3D scatter plot visualizing the spatial distribution of two types of tokens within a three-dimensional embedding space. The plot compares "Latent Tokens" (blue dots) and "Vocab Tokens" (red dot). The visualization suggests an analysis of how different token types are represented in a model's latent space, likely from a natural language processing or machine learning context.
### Components/Axes
* **Legend:** Located in the top-right corner. It contains two entries:
* A blue circle labeled "Latent Tokens".
* A red circle labeled "Vocab Tokens".
* **Axes:** The plot is defined by three orthogonal axes forming a 3D grid.
* **X-axis (Front-Left to Back-Right):** Labeled with numerical values. The visible range is from approximately -160 to 0. Tick marks are at intervals of 20: -160, -140, -120, -100, -80, -60, -40, -20, 0.
* **Y-axis (Front-Right to Back-Left):** Labeled with numerical values. The visible range is from approximately -60 to 80. Tick marks are at intervals of 20: -60, -40, -20, 0, 20, 40, 60, 80.
* **Z-axis (Vertical):** Labeled with numerical values. The visible range is from approximately -15 to 15. Tick marks are at intervals of 5: -15, -10, -5, 0, 5, 10, 15.
* **Grid:** A light gray grid is present on all three planes (XY, XZ, YZ) to aid in spatial orientation.
### Detailed Analysis
**Data Series and Points:**
1. **Latent Tokens (Blue):** There are 5 visible blue data points.
* **Point 1 (Top-Left):** Positioned at approximately X ≈ -150, Y ≈ -40, Z ≈ 10.
* **Point 2 (Center-Left):** Positioned at approximately X ≈ -130, Y ≈ -20, Z ≈ -5.
* **Point 3 (Bottom-Left):** Positioned at approximately X ≈ -110, Y ≈ 0, Z ≈ -10.
* **Point 4 (Center, slightly back):** Positioned at approximately X ≈ -90, Y ≈ 20, Z ≈ -5.
* **Point 5 (Top-Center, back):** Positioned at approximately X ≈ -70, Y ≈ 40, Z ≈ 15.
* **Trend:** The blue points are scattered across the negative X region. They show variation across all three dimensions but are generally clustered in the quadrant defined by negative X and Y values, with Z values ranging from negative to positive.
2. **Vocab Tokens (Red):** There is 1 visible red data point.
* **Point 1 (Bottom-Right):** Positioned at approximately X ≈ -10, Y ≈ 40, Z ≈ -10.
* **Trend:** This single point is an outlier relative to the cluster of blue points. It is located in a region with a much less negative X value and a positive Y value.
### Key Observations
1. **Spatial Separation:** There is a clear spatial separation between the cluster of "Latent Tokens" and the single "Vocab Token." The latent tokens occupy a region with strongly negative X coordinates, while the vocab token is near X=0.
2. **Cluster vs. Isolate:** The latent tokens form a loose cluster, suggesting they may share similar properties in this embedding space. The vocab token is isolated, indicating it is distinct from the latent tokens in this representation.
3. **Dimensional Spread:** The latent tokens are spread across a wide range of Z-values (from -10 to +15), indicating significant variation in the third dimension.
### Interpretation
This plot likely visualizes the output of a dimensionality reduction technique (like PCA or t-SNE) applied to token embeddings from a neural network model. The "Latent Tokens" probably represent internal, model-generated representations (e.g., from a hidden layer or a compressed space), while the "Vocab Tokens" represent standard input tokens from the model's vocabulary.
The observed separation suggests that the model's internal latent representations are fundamentally different in structure from its input vocabulary representations. The clustering of latent tokens implies they have learned a shared, abstract feature space. The isolation of the vocab token could mean it is being represented in a more "raw" or less processed manner. This visualization is crucial for understanding how a model transforms and separates different types of information within its internal architecture. The significant spread in the Z-axis for latent tokens highlights that this transformation is complex and multi-faceted.