## Histogram: Histogram of Drift Function w(n) for Odd n ≤ 10^6
### Overview
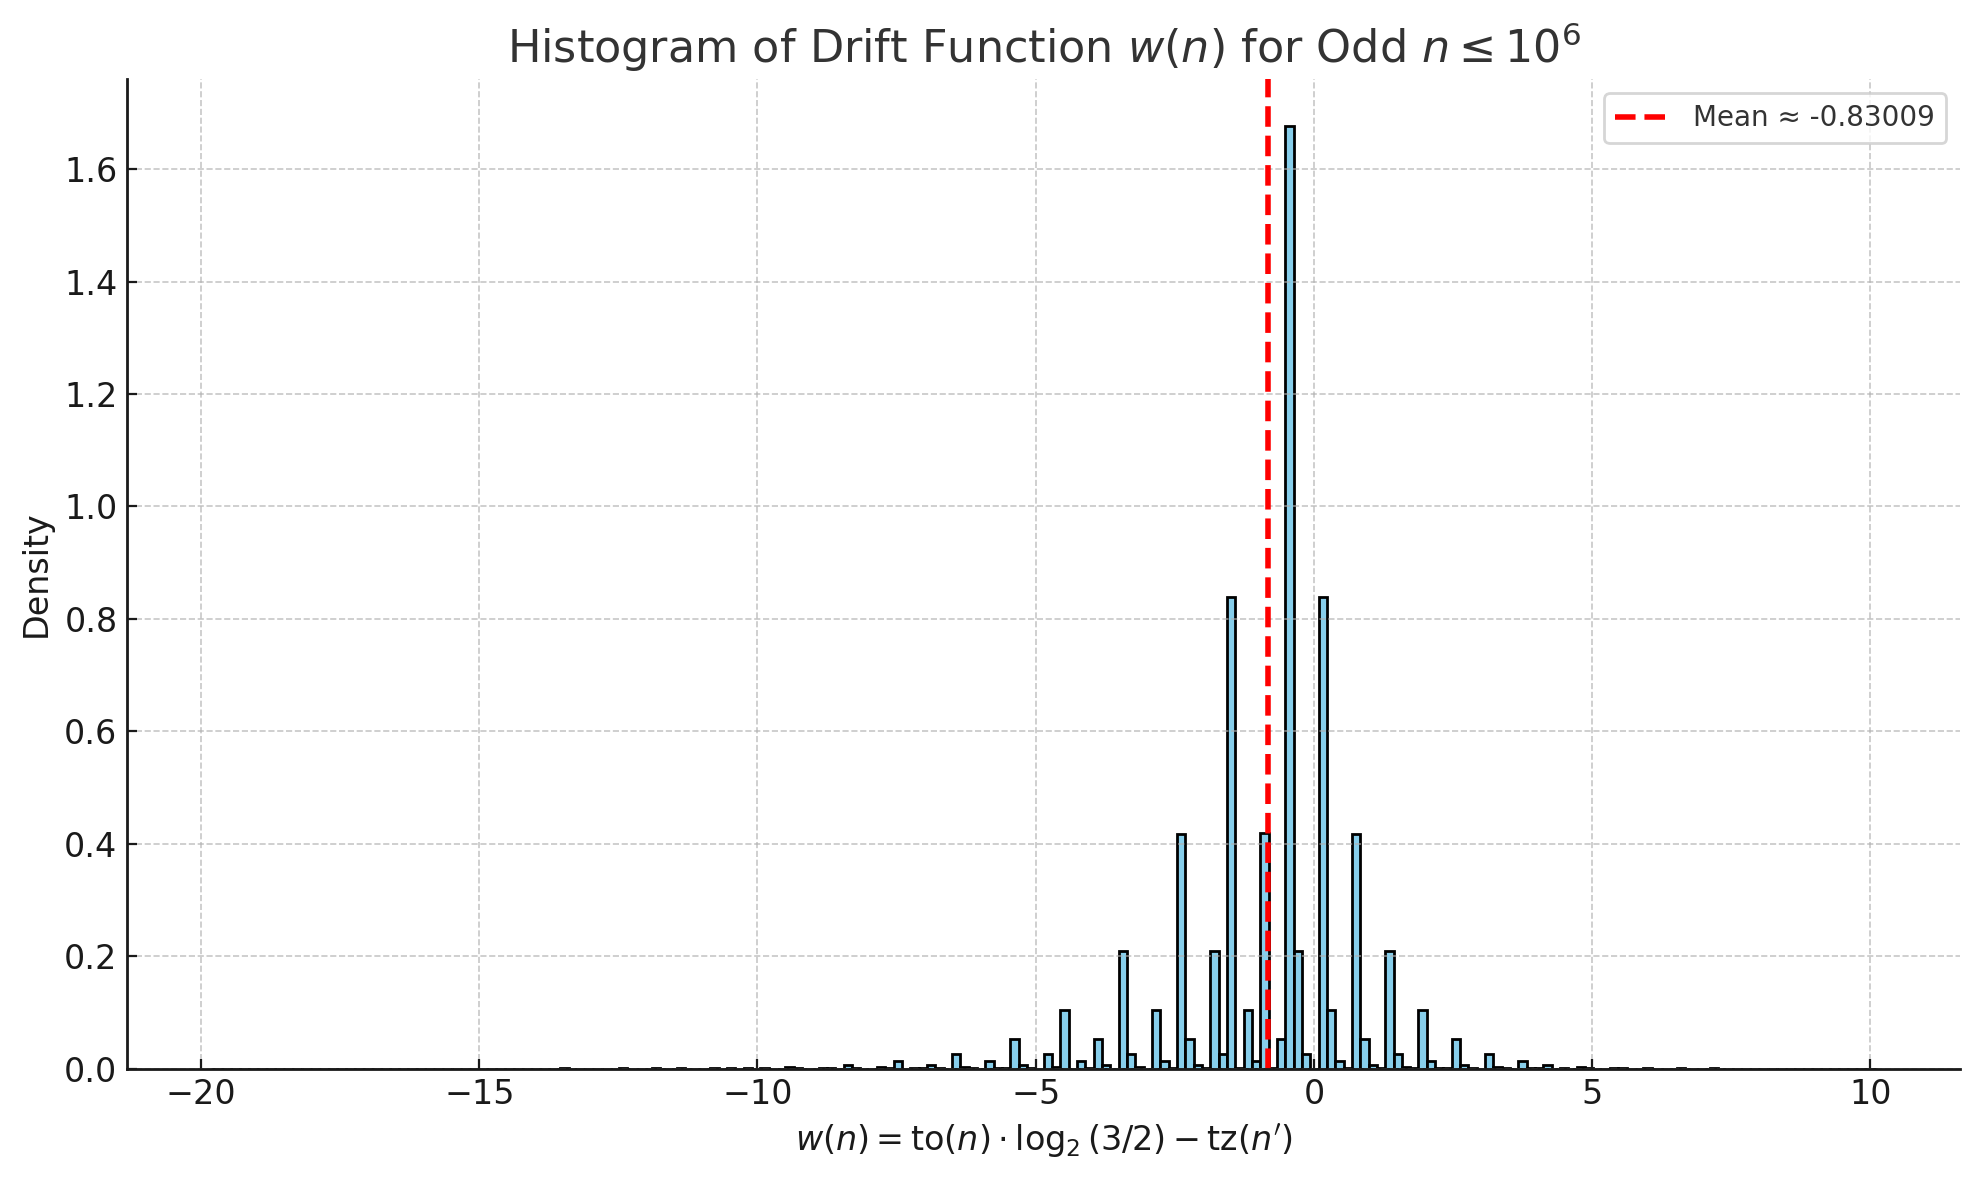
The image is a histogram displaying the distribution of a drift function w(n) for odd numbers n less than or equal to 10^6. The histogram shows the density of the drift function values, with a vertical red dashed line indicating the mean value. The distribution appears to be centered around zero, with a peak near the mean.
### Components/Axes
* **Title:** Histogram of Drift Function w(n) for Odd n ≤ 10^6
* **X-axis:** w(n) = to(n) * log2(3/2) - tz(n')
* Axis markers: -20, -15, -10, -5, 0, 5, 10
* **Y-axis:** Density
* Axis markers: 0.0, 0.2, 0.4, 0.6, 0.8, 1.0, 1.2, 1.4, 1.6
* **Legend:** Located in the top-right corner.
* Red dashed line: Mean ≈ -0.83009
### Detailed Analysis
* The histogram consists of light blue bars with black outlines.
* The distribution is centered around zero, with the highest density near zero.
* The red dashed line, representing the mean, is located at approximately -0.83009 on the x-axis.
* The density values range from approximately 0 to 1.7.
* The x-axis ranges from -20 to 10.
* The bars are concentrated between -5 and 5.
* The bars are very small outside the range of -5 to 5.
### Key Observations
* The distribution is unimodal and centered near zero.
* The mean is slightly negative, approximately -0.83009.
* The distribution is skewed slightly to the left.
* The majority of the data points are clustered around the mean.
### Interpretation
The histogram visualizes the distribution of the drift function w(n) for odd numbers up to 10^6. The concentration of values around zero suggests that the drift function tends to produce values close to zero for most odd numbers within the specified range. The slight negative skew indicates that there are more values slightly below zero than slightly above zero. The mean value of approximately -0.83009 confirms this negative skew. The formula for w(n) involves the binary logarithm and functions to(n) and tz(n'), which likely contribute to the observed distribution.