\n
## Histogram: Histogram of Drift Function w(n) for Odd n ≤ 10⁶
### Overview
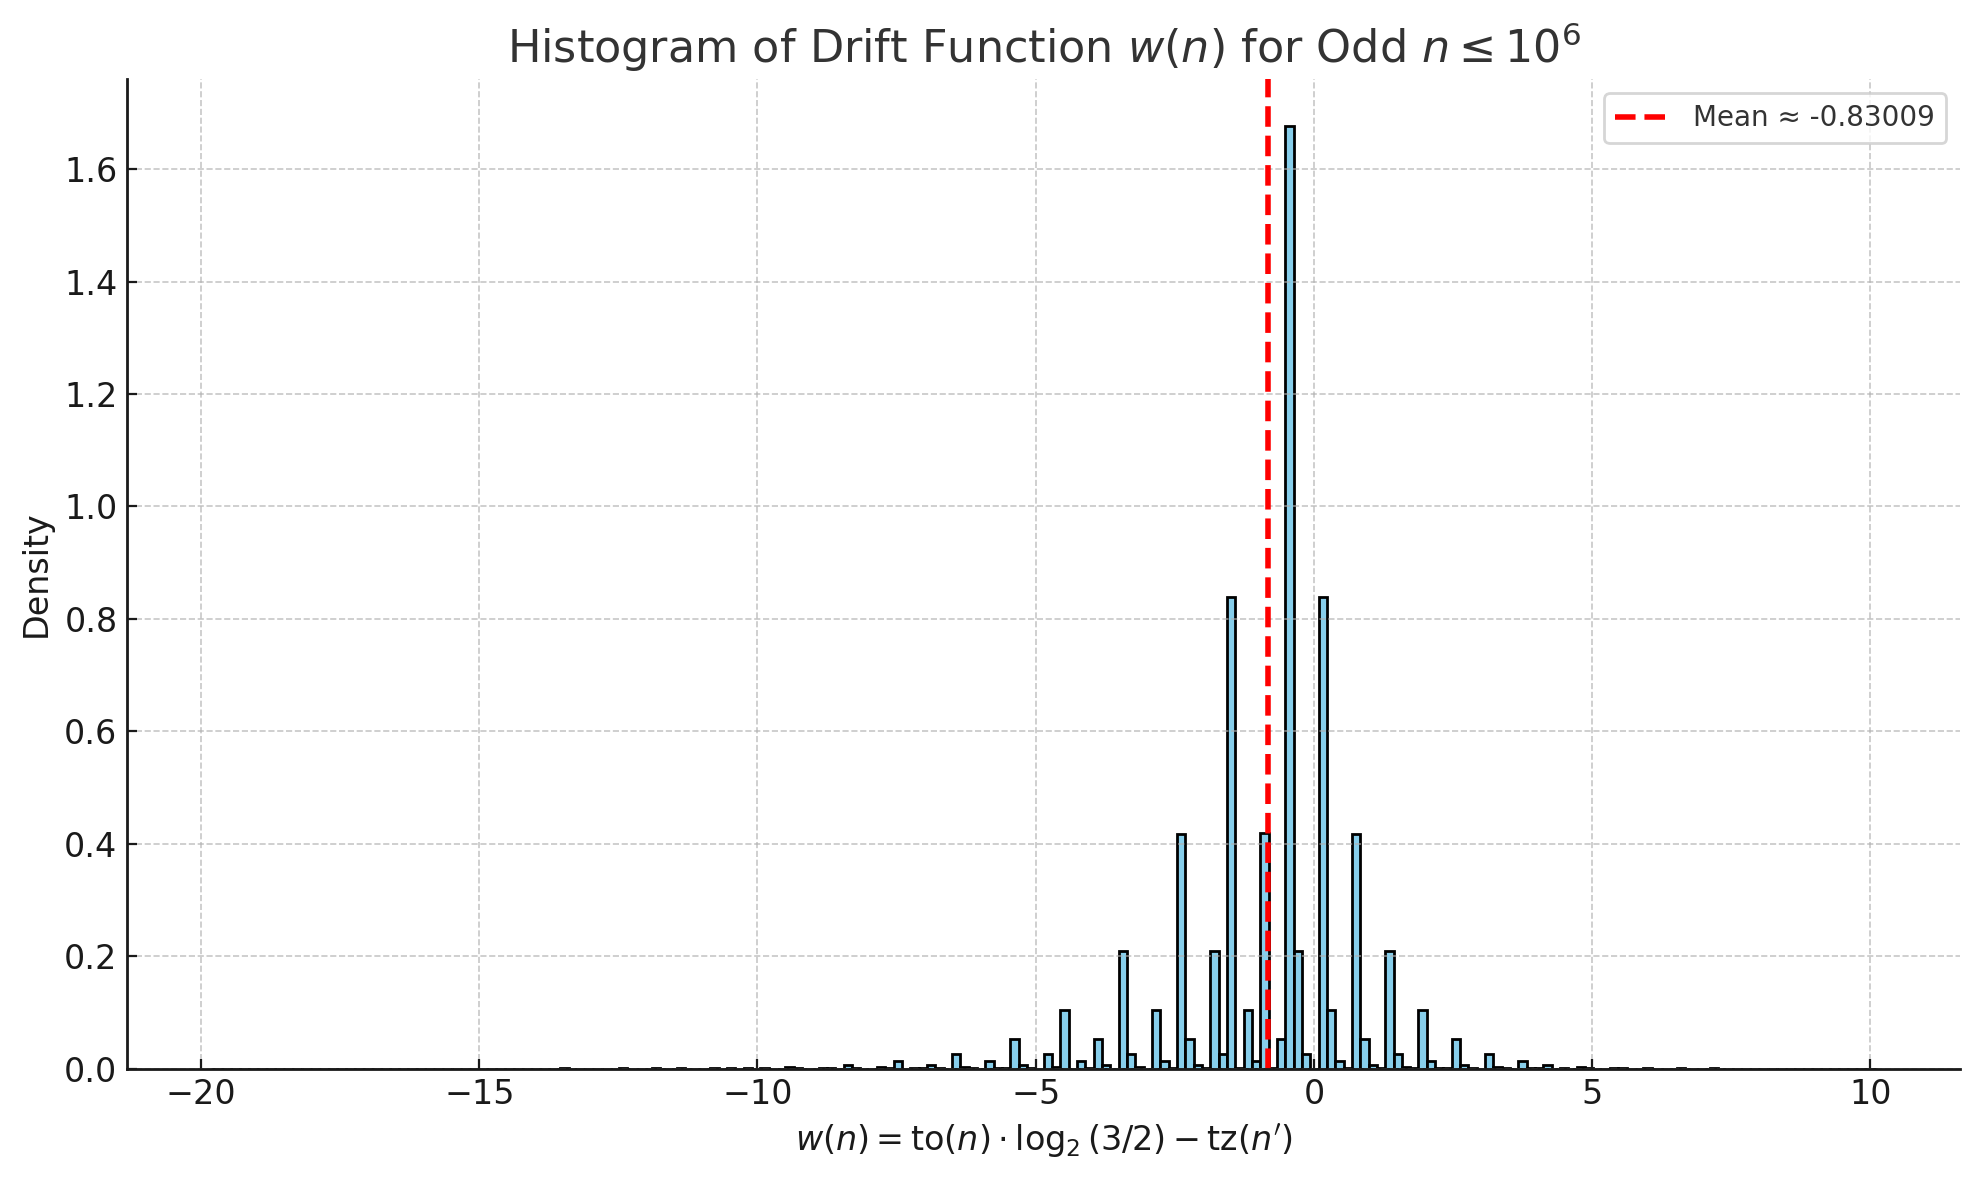
The image presents a histogram visualizing the distribution of the drift function *w(n)* for odd values of *n* less than or equal to 10⁶. The x-axis represents the values of *w(n)*, and the y-axis represents the density (frequency) of those values. A vertical dashed red line indicates the mean of the distribution.
### Components/Axes
* **Title:** "Histogram of Drift Function w(n) for Odd n ≤ 10⁶" (Top-center)
* **X-axis Label:** "w(n) = to(n) ⋅ log₂(3/2) − tz(n')" (Bottom-center)
* **Y-axis Label:** "Density" (Left-center)
* **Y-axis Scale:** 0.0 to 1.6, with increments of 0.2.
* **X-axis Scale:** -20 to 10, with increments of 5.
* **Legend:** Located in the top-right corner.
* "Mean ≈ -0.83009" (Red dashed line)
### Detailed Analysis
The histogram shows a highly concentrated distribution of *w(n)* values. The majority of the data points are clustered around 0.
* **Distribution Shape:** The distribution is approximately symmetric, with a peak near *w(n)* = 0. There is a slight tail extending towards negative values.
* **Mean:** The mean of the distribution is indicated by a red dashed vertical line at approximately *w(n)* = -0.83009.
* **Density at Peak:** The peak density (highest frequency) is approximately 1.55, occurring around *w(n)* = 0.
* **Data Points (Approximate):**
* Between -20 and -15: Density is approximately 0.
* Between -15 and -10: Density is approximately 0.
* Between -10 and -5: Density increases to approximately 0.1.
* Between -5 and 0: Density increases rapidly to approximately 1.55.
* At 0: Density is approximately 1.55.
* Between 0 and 5: Density decreases rapidly to approximately 0.2.
* Between 5 and 10: Density is approximately 0.
### Key Observations
* The distribution is heavily skewed towards zero.
* The mean is slightly negative (-0.83009), indicating a slight bias towards negative *w(n)* values.
* The data is concentrated within a relatively narrow range of *w(n)* values.
### Interpretation
The histogram suggests that the drift function *w(n)*, for odd *n* up to 10⁶, tends to be close to zero. The slight negative mean indicates a small tendency for the drift to be negative. The concentration of data points around zero suggests that the drift is relatively stable for most values of *n*. The formula for *w(n)*, provided on the x-axis, indicates that it is a function of *n* involving a logarithmic term and another function *tz(n')*. The distribution's shape likely reflects the behavior of these underlying functions. The fact that the data is limited to odd *n* may also influence the distribution. The narrow range of values suggests that the system being modeled by *w(n)* is relatively well-behaved, with limited drift.