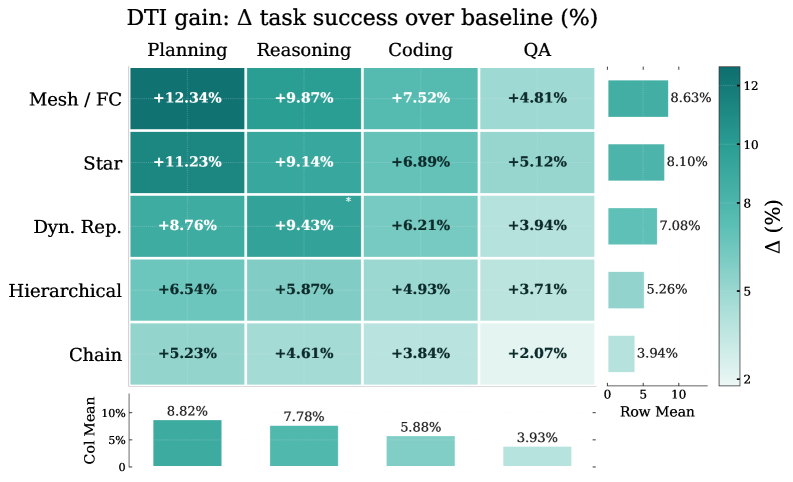
## Heatmap: DTI gain: Δ task success over baseline (%)
### Overview
The heatmap visualizes the percentage improvement in task success rates for different cognitive tasks (Planning, Reasoning, Coding, QA) across five methods (Mesh/FC, Star, Dyn. Rep., Hierarchical, Chain). Darker green shades represent higher percentage gains, with values ranging from 2% to 12%.
### Components/Axes
- **X-axis (Tasks)**: Planning, Reasoning, Coding, QA
- **Y-axis (Methods)**: Mesh/FC, Star, Dyn. Rep., Hierarchical, Chain
- **Color Legend**: Right-aligned vertical bar (2% to 12%, darker green = higher gain)
- **Row Means**: Bottom row (average gain per method across tasks)
- **Column Means**: Right column (average gain per task across methods)
- **Asterisk**: Appears in Dyn. Rep. row under Reasoning task (unexplained in image)
### Detailed Analysis
#### Task-Specific Gains
- **Planning**:
- Mesh/FC: +12.34% (darkest green)
- Star: +11.23%
- Dyn. Rep.: +8.76%
- Hierarchical: +6.54%
- Chain: +5.23%
- **Reasoning**:
- Mesh/FC: +9.87%
- Star: +9.14%
- Dyn. Rep.: +9.43% (asterisk)
- Hierarchical: +5.87%
- Chain: +4.61%
- **Coding**:
- Mesh/FC: +7.52%
- Star: +6.89%
- Dyn. Rep.: +6.21%
- Hierarchical: +4.93%
- Chain: +3.84%
- **QA**:
- Mesh/FC: +4.81%
- Star: +5.12%
- Dyn. Rep.: +3.94%
- Hierarchical: +3.71%
- Chain: +2.07%
#### Row/Column Means
- **Row Means (Method Averages)**:
- Mesh/FC: 8.63%
- Star: 8.10%
- Dyn. Rep.: 7.08%
- Hierarchical: 5.26%
- Chain: 3.94%
- **Column Means (Task Averages)**:
- Planning: 8.82%
- Reasoning: 7.78%
- Coding: 5.88%
- QA: 3.93%
### Key Observations
1. **Mesh/FC** dominates in Planning (+12.34%) and Reasoning (+9.87%), with the highest overall average (8.63%).
2. **Chain** underperforms across all tasks, with the lowest gains (e.g., +2.07% in QA).
3. **Dyn. Rep.** shows a notable asterisk in Reasoning (+9.43%), suggesting potential statistical significance or outlier status.
4. **QA task** has the lowest average gains (3.93%), indicating weaker performance across all methods.
5. **Planning** task has the highest average gain (8.82%), followed by Reasoning (7.78%).
### Interpretation
The data suggests that **Mesh/FC** and **Star** methods excel in cognitively demanding tasks (Planning/Reasoning), while **Chain** struggles across all domains. The **QA task** shows minimal gains overall, possibly due to its reliance on domain-specific knowledge rather than general cognitive skills. The asterisk on Dyn. Rep. in Reasoning warrants further investigation but is unexplained in the image. The heatmap highlights a clear hierarchy in method effectiveness, with Planning tasks benefiting most from advanced reasoning frameworks.