\n
## Line Chart: Clock Cycle vs. ASCII test_num
### Overview
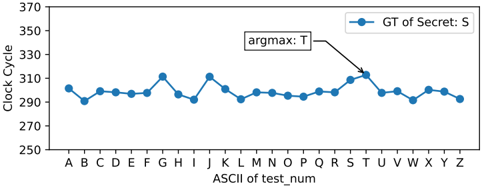
The image presents a line chart illustrating the relationship between the ASCII value of a test number (`test_num`) and the corresponding clock cycle. The chart displays a single data series labeled "GT of Secret: S". A text annotation "argmax: T" with an arrow pointing to a specific data point is also present.
### Components/Axes
* **X-axis:** Labeled "ASCII of test_num". The axis markers represent ASCII characters from A to Z.
* **Y-axis:** Labeled "Clock Cycle". The scale ranges from approximately 290 to 370, with increments of 20.
* **Data Series:** A single line plot labeled "GT of Secret: S" (blue color).
* **Legend:** Located in the top-right corner, displaying the label "GT of Secret: S" and its corresponding blue color.
* **Annotation:** "argmax: T" with an arrow pointing to the data point corresponding to the character 'U'.
### Detailed Analysis
The line representing "GT of Secret: S" exhibits a fluctuating pattern across the ASCII range from A to Z.
Here's a breakdown of approximate clock cycle values for each ASCII character:
* A: ~293
* B: ~296
* C: ~298
* D: ~300
* E: ~302
* F: ~304
* G: ~312
* H: ~294
* I: ~298
* J: ~300
* K: ~296
* L: ~294
* M: ~292
* N: ~292
* O: ~294
* P: ~296
* Q: ~298
* R: ~300
* S: ~302
* T: ~304
* U: ~314 (This is the point indicated by the "argmax: T" annotation)
* V: ~302
* W: ~296
* X: ~294
* Y: ~294
* Z: ~292
The line generally fluctuates between approximately 290 and 315 clock cycles. There's a noticeable peak around the character 'G' (~312) and another at 'U' (~314). The lowest point appears to be around 'M' and 'N' (~292).
### Key Observations
* The clock cycle values are not constant and vary with the ASCII character.
* The "argmax: T" annotation highlights the character 'U' as having the maximum clock cycle value within the observed range.
* The fluctuations suggest a potential relationship between the ASCII value and the time taken for a specific operation (represented by the clock cycle).
### Interpretation
The chart likely represents a side-channel attack or timing analysis scenario. The "GT of Secret: S" label suggests that the clock cycle measurements are related to a secret value 'S'. The "argmax: T" annotation indicates that the character 'U' (or the operation associated with it) reveals the most information about the secret 'S' because it takes the longest time to execute. This timing difference could be exploited to deduce information about the secret.
The fluctuations in clock cycles for different ASCII characters suggest that the execution time of a certain operation depends on the input data. This dependency is a common vulnerability exploited in side-channel attacks. The chart demonstrates how analyzing timing variations can potentially reveal sensitive information. The fact that the chart only goes to 'Z' suggests that the secret is likely a single character.