\n
## Line Chart: Clock Cycle vs. ASCII Character
### Overview
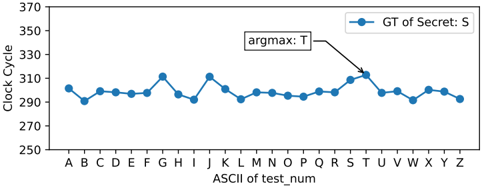
The image displays a line chart plotting "Clock Cycle" values against a sequence of ASCII characters labeled "test_num". The chart compares two data series: a primary series labeled "GT of Secret: S" and a single highlighted data point labeled "argmax: T". The overall trend shows fluctuating clock cycle values across the alphabet, with a notable peak at the character 'T'.
### Components/Axes
* **Chart Type:** Line chart with circular markers for the primary series and a square marker for the highlighted point.
* **X-Axis:**
* **Label:** `ASCII of test_num`
* **Scale/Ticks:** Discrete categorical scale listing uppercase letters from `A` to `Z` in alphabetical order.
* **Y-Axis:**
* **Label:** `Clock Cycle`
* **Scale/Ticks:** Linear numerical scale ranging from 250 to 370, with major tick marks at intervals of 20 (250, 270, 290, 310, 330, 350, 370).
* **Legend:**
* **Position:** Top-right corner of the chart area.
* **Entry 1:** `GT of Secret: S` - Represented by a blue line with circular markers.
* **Entry 2:** `argmax: T` - Represented by a black line with a square marker. This series appears to consist of only a single data point.
* **Annotation:**
* A text box containing `argmax: T` is positioned above the data point for 'T', with a line pointing directly to the square marker at that location.
### Detailed Analysis
**Data Series: "GT of Secret: S" (Blue Line)**
* **Trend Verification:** The blue line exhibits an oscillating pattern with no consistent upward or downward slope. It fluctuates around a central value of approximately 295-305 clock cycles.
* **Data Points (Approximate Values):**
* A: ~300
* B: ~290 (Local minimum)
* C: ~298
* D: ~298
* E: ~298
* F: ~298
* G: ~310 (Local peak)
* H: ~290
* I: ~298
* J: ~310 (Local peak)
* K: ~298
* L: ~290
* M: ~298
* N: ~298
* O: ~298
* P: ~298
* Q: ~298
* R: ~300
* S: ~305
* T: ~308 (This is the point connected to the "argmax" marker)
* U: ~298
* V: ~298
* W: ~290
* X: ~298
* Y: ~298
* Z: ~295
**Data Series: "argmax: T" (Black Marker)**
* **Component Isolation:** This is a single, isolated data point, not a continuous series.
* **Position & Value:** Located at x-axis position `T`. Its y-axis value is approximately **312**, which is slightly higher than the corresponding blue data point for 'T' (~308). The black square marker is placed directly above the blue circle marker for 'T', connected by a short vertical black line.
### Key Observations
1. **Peak at 'T':** The character 'T' corresponds to the highest clock cycle value for the "GT of Secret: S" series and is explicitly highlighted as the "argmax" (argument of the maximum).
2. **Pattern of Dips:** Distinct local minima (valleys) occur at characters `B`, `H`, `L`, and `W`, all dropping to approximately 290 clock cycles.
3. **Pattern of Peaks:** Local maxima occur at `G`, `J`, and `T`, reaching or exceeding 310 clock cycles.
4. **Stability:** A significant portion of the characters (C-F, I, K, M-Q, U, X, Y) show very similar, stable clock cycle values hovering around 298.
5. **Visual Emphasis:** The chart uses a connecting line and annotation to draw direct attention to the comparison between the "GT" value and the "argmax" value at the character 'T'.
### Interpretation
This chart appears to analyze the performance (measured in clock cycles) of a system or algorithm when processing different ASCII characters as part of a "test_num". The "GT of Secret: S" likely represents the ground truth or baseline measurement for a secret value 'S'. The "argmax: T" indicates that the character 'T' produced the maximum observed clock cycle value in this test.
The data suggests that processing time is not uniform across all characters. The system exhibits characteristic peaks and valleys, which could be due to factors like:
* **Hardware/Software Optimization:** Certain character codes might trigger more efficient or less efficient code paths.
* **Data-Dependent Behavior:** If this relates to a cryptographic or side-channel analysis (hinted by "Secret"), the variations could leak information about internal processing.
* **Lookup Table or Cache Effects:** The pattern of stable values with specific dips and peaks might reflect memory access patterns.
The key takeaway is the identification of 'T' as the most "expensive" character in terms of clock cycles for this specific test, which is the primary insight the visualization is designed to communicate. The oscillating but bounded nature of the data indicates a system with predictable, character-dependent performance characteristics.