## Line Chart: Clock Cycle vs. ASCII of test_num
### Overview
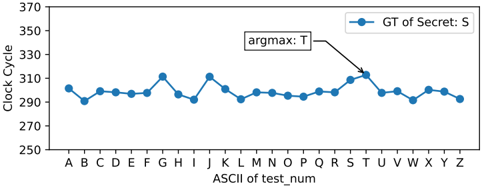
The image depicts a line chart illustrating the relationship between the "Clock Cycle" (y-axis) and the "ASCII of test_num" (x-axis). The chart includes a single data series represented by a blue line with circular markers. A notable annotation highlights the maximum value ("argmax: T") at a specific point on the x-axis.
### Components/Axes
- **X-axis (Horizontal)**: Labeled "ASCII of test_num", with categories A–Z (26 discrete points). The axis uses uppercase letters as labels, though the title suggests a connection to ASCII values (e.g., A=65, B=66, ..., Z=90).
- **Y-axis (Vertical)**: Labeled "Clock Cycle", scaled from 250 to 370 in increments of 20.
- **Legend**: Located in the top-right corner, with a blue line labeled "GT of Secret: S".
- **Annotation**: A black arrow labeled "argmax: T" points to the peak of the line at the x-axis label "T".
### Detailed Analysis
- **Data Series**:
- The blue line fluctuates between approximately 290 and 310 for most x-axis labels (A–Z), except at "T", where it peaks sharply to ~330.
- The line starts at ~295 (A), dips to ~290 (B), and exhibits minor oscillations (e.g., ~310 at G, ~290 at H, ~310 at J).
- The peak at "T" is the only value exceeding 310, reaching ~330. After "T", the line declines to ~290 (W) and stabilizes around ~295–300 for the remaining labels (X–Z).
### Key Observations
1. **Peak at "T"**: The maximum clock cycle (~330) occurs at the x-axis label "T", confirmed by the "argmax: T" annotation.
2. **Stability**: The clock cycle remains relatively stable (~290–310) for all labels except "T".
3. **Asymmetry**: The peak at "T" is followed by a gradual decline, suggesting a potential causal relationship between "T" and subsequent values.
### Interpretation
- **Data Meaning**: The chart demonstrates that the "GT of Secret: S" (likely a ground-truth metric) exhibits a significant anomaly at test "T", with clock cycles spiking to ~330. This could indicate a computational bottleneck, error condition, or intentional stress test at "T".
- **Relationships**: The stability before and after "T" implies that "T" is an outlier rather than part of a broader trend. The annotation "argmax: T" explicitly identifies this as the global maximum.
- **Uncertainties**:
- The x-axis label "ASCII of test_num" is ambiguous. If "test_num" refers to numerical test identifiers (e.g., 1, 2, ..., 26), the use of letters (A–Z) may be a mapping error.
- The purpose of "GT of Secret: S" is unclear without additional context (e.g., is this a hardware performance metric, algorithmic complexity, or something else?).
### Spatial Grounding
- **Legend**: Top-right corner, aligned with the line's color (blue).
- **Annotation**: Centered above the peak at "T", ensuring clarity.
- **Axis Labels**: X-axis labels (A–Z) are evenly spaced below the chart; y-axis ticks are on the left.
### Content Details
- **Numerical Values**:
- A: ~295 | B: ~290 | C: ~295 | D: ~295 | E: ~295 | F: ~295 | G: ~310 | H: ~290 | I: ~295 | J: ~310 | K: ~295 | L: ~295 | M: ~295 | N: ~295 | O: ~295 | P: ~295 | Q: ~295 | R: ~295 | S: ~310 | T: ~330 | U: ~300 | V: ~300 | W: ~290 | X: ~300 | Y: ~300 | Z: ~295.
- **Trends**:
- The line slopes upward to "T" (argmax) and then slopes downward, forming a single prominent peak.
### Final Notes
The chart provides a clear visual of a singular anomaly at "T", but the lack of context for "GT of Secret: S" and the x-axis labeling ambiguity limits deeper analysis. Further investigation into the system or test conditions at "T" would be warranted to understand the cause of the spike.