## Scatter Plot: Energy Consumption of DNNs Over Time
### Overview
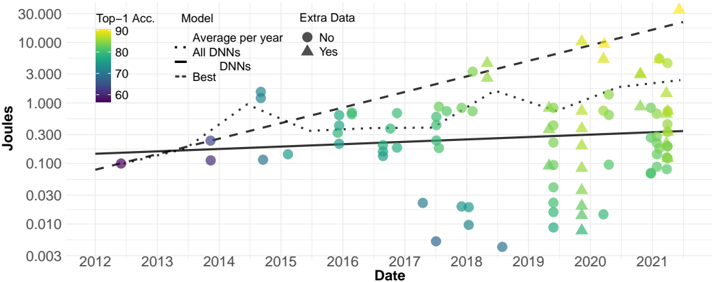
The image is a scatter plot showing the energy consumption (in Joules) of Deep Neural Networks (DNNs) over time (from 2012 to 2021). The plot includes data points for individual DNNs, as well as trend lines representing the average energy consumption per year and the energy consumption of the "best" DNNs. The color of each data point indicates the Top-1 Accuracy of the model, ranging from purple (60) to yellow (90). The shape of the data point indicates whether extra data was used (triangle = Yes, circle = No).
### Components/Axes
* **X-axis:** Date (Year), ranging from 2012 to 2021.
* **Y-axis:** Joules (Energy Consumption), on a logarithmic scale from 0.003 to 30.000.
* **Color Legend (Top-Left):** Top-1 Accuracy, ranging from 60 (purple) to 90 (yellow).
* **Shape Legend (Top-Right):** Extra Data, with circles representing "No" and triangles representing "Yes".
* **Line Legend (Top-Center):** Model, with a dotted line representing "Average per year", a solid line representing "All DNNs", and a dashed line representing "Best DNNs".
### Detailed Analysis
* **Y-Axis Scale:** The Y-axis is logarithmic. The major tick marks are at 0.003, 0.010, 0.030, 0.100, 0.300, 1.000, 3.000, 10.000, and 30.000 Joules.
* **Data Point Shapes:** Circles and Triangles. Circles represent "No Extra Data", Triangles represent "Yes Extra Data".
* **Color Gradient:** The color of the data points represents the "Top-1 Accuracy". Purple represents 60, and Yellow represents 90. The color transitions smoothly between these values.
* **Average per year (Dotted Line):**
* 2012: Approximately 0.1 Joules.
* 2014: Approximately 0.3 Joules.
* 2017: Approximately 0.5 Joules.
* 2019: Approximately 0.7 Joules.
* 2021: Approximately 1.0 Joules.
* Trend: The average energy consumption per year shows an upward trend, increasing from approximately 0.1 Joules in 2012 to approximately 1.0 Joules in 2021.
* **All DNNs (Solid Line):**
* 2012: Approximately 0.15 Joules.
* 2021: Approximately 0.3 Joules.
* Trend: The energy consumption of all DNNs shows a slight upward trend, increasing from approximately 0.15 Joules in 2012 to approximately 0.3 Joules in 2021.
* **Best DNNs (Dashed Line):**
* 2012: Approximately 0.1 Joules.
* 2014: Approximately 0.2 Joules.
* 2017: Approximately 0.5 Joules.
* 2019: Approximately 1.0 Joules.
* 2021: Approximately 10.0 Joules.
* Trend: The energy consumption of the best DNNs shows a significant upward trend, increasing from approximately 0.1 Joules in 2012 to approximately 10.0 Joules in 2021.
* **Individual Data Points:**
* The data points are scattered across the plot, with a higher concentration of points in the later years (2018-2021).
* The color of the data points generally shifts from purple/blue in the earlier years to green/yellow in the later years, indicating an increase in Top-1 Accuracy over time.
* The presence of both circles and triangles in each year suggests that some DNNs used extra data while others did not.
### Key Observations
* Energy consumption generally increases over time for all models.
* The "Best DNNs" exhibit a much steeper increase in energy consumption compared to the average.
* Top-1 Accuracy tends to increase over time, as indicated by the color gradient.
* There is a wide range of energy consumption values for DNNs in any given year.
* The use of extra data is prevalent throughout the years.
### Interpretation
The data suggests that while the average energy consumption of DNNs has increased over time, the "best" DNNs have experienced a much more significant increase in energy consumption. This could be due to the increasing complexity and size of these models, as well as the use of more computationally intensive techniques. The increase in Top-1 Accuracy over time suggests that these more energy-intensive models are also more accurate. The scatter of data points indicates a wide variety of DNN architectures and training methods, each with its own energy consumption profile. The presence of both circles and triangles suggests that the use of extra data is not necessarily correlated with higher accuracy or lower energy consumption. Overall, the plot highlights the trade-offs between energy consumption, accuracy, and the use of extra data in DNNs.