## Scatter Plot with Trend Lines: Energy Consumption (Joules) vs. Date for Deep Learning Models
### Overview
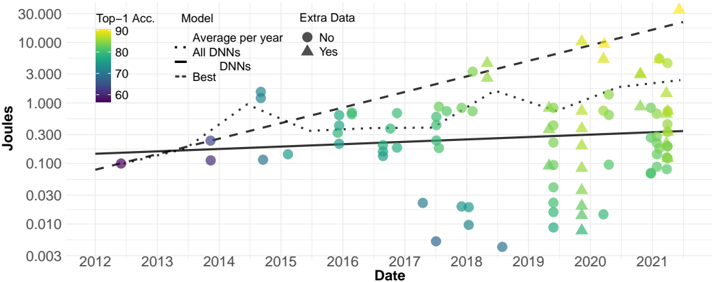
This image is a scatter plot chart displaying the energy consumption (in Joules) of various deep learning models over time, from approximately 2012 to 2021. The chart includes multiple data series distinguished by marker shape and color, along with three trend lines. The y-axis uses a logarithmic scale. The primary purpose appears to be visualizing the relationship between model accuracy, energy consumption, and the use of extra data over the years.
### Components/Axes
* **X-Axis (Horizontal):**
* **Label:** "Date"
* **Scale:** Linear, with major tick marks for each year from 2012 to 2021.
* **Y-Axis (Vertical):**
* **Label:** "Joules"
* **Scale:** Logarithmic, with major tick marks at 0.003, 0.010, 0.030, 0.100, 0.300, 1.000, 3.000, 10.000, and 30.000.
* **Legends (Top-Left Corner):**
1. **Color Bar Legend ("Top-1 Acc."):** A vertical gradient bar mapping color to Top-1 Accuracy percentage.
* **Purple/Dark Blue:** ~60
* **Teal/Green:** ~70
* **Light Green:** ~80
* **Yellow:** ~90
2. **Model Legend:**
* **Dotted Line (····):** "Average per year"
* **Dash-Dot Line (-·-·):** "All DNNs"
* **Dashed Line (----):** "Best"
3. **Extra Data Legend:**
* **Circle Marker (●):** "No"
* **Triangle Marker (▲):** "Yes"
* **Data Points:** Scattered across the chart, each point's color corresponds to its Top-1 Accuracy (per the color bar), and its shape indicates whether "Extra Data" was used.
### Detailed Analysis
**Data Series & Trends:**
1. **"Best" Trend Line (Dashed):** This line shows a clear, strong upward trend from left to right. It starts near 0.1 Joules in 2012 and rises to approximately 20-30 Joules by 2021. This suggests the most energy-efficient models ("Best") have seen a consistent increase in energy consumption over the decade.
2. **"All DNNs" Trend Line (Dash-Dot):** This line also trends upward but with a shallower slope than the "Best" line. It begins around 0.1 Joules in 2012 and ends near 3-5 Joules in 2021. It represents the general trend across all deep neural networks plotted.
3. **"Average per year" Trend Line (Dotted):** This line is more volatile, showing peaks and valleys. It generally follows an upward trajectory but dips notably around 2016-2017 before rising again. It ends near 2-3 Joules in 2021.
4. **Data Points Distribution:**
* **Early Years (2012-2015):** Fewer data points. Most are circles (no extra data) with colors in the purple-to-teal range (accuracy ~60-70). Energy consumption is mostly between 0.1 and 1 Joule.
* **Middle Years (2016-2018):** Increased density of points. A mix of circles and triangles appears. Colors expand to include more greens (~80 accuracy). Energy consumption spans a wider range, from as low as ~0.005 Joules (a notable outlier in 2018) to over 1 Joule.
* **Later Years (2019-2021):** Highest density of points. Triangles (extra data) become very common, especially in 2020-2021. Colors shift significantly towards yellow (~90 accuracy). Energy consumption shows extreme variance: many points cluster between 0.1 and 1 Joule, but several high-accuracy (yellow) models, particularly triangles, reach 10-30 Joules.
**Spatial Grounding & Color Cross-Reference:**
* The highest energy consumption points (top-right corner, 2020-2021) are almost exclusively **yellow triangles**, confirming that the most accurate models using extra data are also the most energy-intensive.
* The lowest energy consumption points (bottom-center, ~2018) are **teal circles**, indicating models with ~70 accuracy that did not use extra data.
* The "Best" (dashed) line passes through the lower envelope of the data points, suggesting it tracks the minimum energy consumption for a given time/accuracy trade-off.
### Key Observations
1. **Strong Positive Correlation:** There is a clear overall trend that models published later in time tend to consume more energy.
2. **Accuracy-Energy Trade-off:** Higher Top-1 Accuracy (yellow colors) is strongly associated with higher energy consumption, especially in recent years.
3. **Impact of Extra Data:** The prevalence of triangle markers (extra data) in the high-accuracy, high-energy region (2019-2021) suggests that using extra data is a common strategy for achieving state-of-the-art accuracy, but it comes at a significant energy cost.
4. **Increased Variance Over Time:** The spread of energy consumption values (vertical scatter) increases dramatically from 2012 to 2021, indicating a diversification in model architectures and efficiency.
5. **Notable Outlier:** A single data point around mid-2018 sits far below the general cluster, at approximately **0.005 Joules**. This represents an exceptionally energy-efficient model for its time.
### Interpretation
This chart illustrates the "scaling law" phenomenon in deep learning, where pursuing higher model accuracy has historically required—and continues to require—exponentially increasing computational resources (here measured by energy in Joules). The upward-sloping trend lines confirm that the field's progress in accuracy has been tightly coupled with rising energy costs.
The shift from circles to triangles and from purple to yellow colors over time tells a story of methodological evolution: the community has increasingly relied on both larger datasets ("Extra Data") and more complex, accurate models, both of which drive up energy consumption. The "Best" line's steep slope is particularly telling; even the most efficient models at the frontier of performance are not becoming more energy-efficient over time; they are consuming more energy to achieve better results.
The high variance in recent years, however, offers a nuanced view. While the frontier (high accuracy) is energy-intensive, the presence of many points in the 0.1-1 Joule range even in 2021 suggests ongoing research into efficiency. The outlier in 2018 serves as a reminder that breakthroughs in efficiency are possible but are not yet the dominant trend. Ultimately, the data underscores a critical challenge for sustainable AI: decoupling the pursuit of higher model performance from its escalating energy footprint.