\n
## Line Chart: Speedup vs. Optimization Latency
### Overview
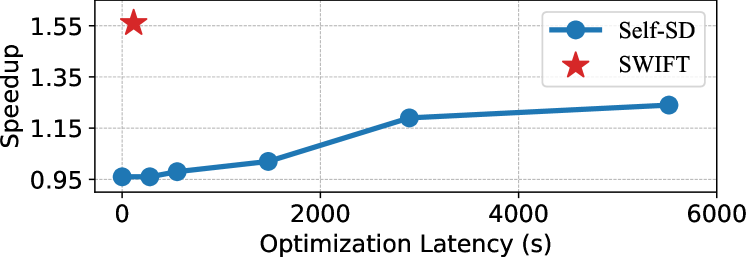
This line chart compares the speedup achieved by "Self-SD" and "SWIFT" across varying optimization latencies. The x-axis represents optimization latency in seconds, and the y-axis represents speedup. The chart shows how speedup changes as optimization time increases for both methods.
### Components/Axes
* **X-axis Title:** Optimization Latency (s)
* **Y-axis Title:** Speedup
* **X-axis Scale:** 0 to 6000 seconds, with gridlines at 0, 1000, 2000, 3000, 4000, 5000, and 6000.
* **Y-axis Scale:** 0.9 to 1.55, with gridlines at 0.95, 1.05, 1.15, 1.25, 1.35, 1.45, and 1.55.
* **Legend:** Located in the top-right corner.
* "Self-SD" - Represented by a blue line with circular markers.
* "SWIFT" - Represented by a red star marker.
### Detailed Analysis
The chart displays two data series: "Self-SD" and "SWIFT".
**Self-SD (Blue Line):**
The line slopes generally upward, indicating that speedup increases with optimization latency.
* At 0 seconds latency, the speedup is approximately 0.96.
* At approximately 1000 seconds latency, the speedup is approximately 0.98.
* At approximately 2000 seconds latency, the speedup is approximately 1.05.
* At approximately 3000 seconds latency, the speedup is approximately 1.16.
* At approximately 4000 seconds latency, the speedup is approximately 1.20.
* At approximately 5000 seconds latency, the speedup is approximately 1.23.
* At 6000 seconds latency, the speedup is approximately 1.25.
**SWIFT (Red Star):**
A single data point is shown for "SWIFT".
* At 0 seconds latency, the speedup is approximately 1.55.
### Key Observations
* "SWIFT" exhibits a significantly higher speedup than "Self-SD" at 0 seconds latency.
* "Self-SD" shows a consistent, albeit gradual, increase in speedup as optimization latency increases.
* The chart only provides a single data point for "SWIFT", making it difficult to assess its performance trend across different optimization latencies.
### Interpretation
The data suggests that "SWIFT" offers a substantial initial speedup compared to "Self-SD" when no optimization latency is involved. However, as optimization time increases, "Self-SD" gradually improves its speedup, potentially approaching or even surpassing "SWIFT" at higher latency values (though this cannot be definitively determined from the provided data). The lack of data points for "SWIFT" beyond 0 seconds latency limits the ability to draw comprehensive conclusions about its overall performance. The chart highlights a trade-off between initial speedup (favored by "SWIFT") and sustained improvement with optimization time (favored by "Self-SD"). Further investigation with more data points for "SWIFT" is needed to understand its behavior across a wider range of optimization latencies.