## Line Graph: Speedup vs Optimization Latency
### Overview
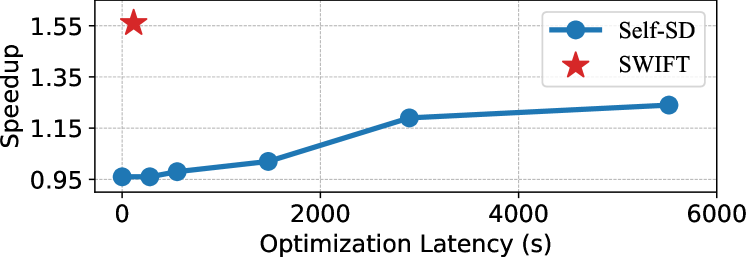
The image is a line graph comparing the performance of two optimization methods, "Self-SD" and "SWIFT," across varying optimization latency (in seconds). The y-axis represents "Speedup," and the x-axis represents "Optimization Latency (s)." The graph includes a legend, gridlines, and two distinct data series.
---
### Components/Axes
- **X-axis (Horizontal)**:
- Label: "Optimization Latency (s)"
- Scale: 0 to 6000 seconds (increments of 2000).
- Position: Bottom of the graph.
- **Y-axis (Vertical)**:
- Label: "Speedup"
- Scale: 0.95 to 1.55 (increments of 0.10).
- Position: Left side of the graph.
- **Legend**:
- Located in the top-right corner.
- Entries:
- **Self-SD**: Blue line with circular markers (●).
- **SWIFT**: Red star marker (★).
- **Gridlines**:
- Light gray dashed lines spanning the plot area.
---
### Detailed Analysis
#### Self-SD (Blue Line with Circles)
- **Trend**: The line slopes upward, indicating increasing speedup with higher optimization latency.
- **Data Points**:
- At 0s: Speedup ≈ 0.95.
- At 1000s: Speedup ≈ 0.97.
- At 2000s: Speedup ≈ 1.05.
- At 3000s: Speedup ≈ 1.15.
- At 6000s: Speedup ≈ 1.25.
#### SWIFT (Red Star)
- **Trend**: A single outlier point at 0s optimization latency.
- **Data Point**:
- At 0s: Speedup ≈ 1.55.
---
### Key Observations
1. **SWIFT Outlier**: The red star (SWIFT) is positioned at the top-left corner (0s latency, 1.55 speedup), significantly higher than the Self-SD baseline.
2. **Self-SD Progression**: The blue line shows a gradual, linear increase in speedup as optimization latency increases.
3. **Latency-Speedup Tradeoff**: SWIFT achieves higher speedup at minimal latency, while Self-SD requires longer latency to improve performance.
---
### Interpretation
- **Performance Comparison**:
- SWIFT demonstrates superior speedup (1.55) at 0s latency, suggesting it is more efficient for low-latency scenarios.
- Self-SD’s speedup grows linearly with latency, indicating it may be better suited for applications where higher latency is acceptable for incremental gains.
- **Anomaly**: The SWIFT data point deviates sharply from the Self-SD trend, implying a fundamentally different optimization strategy or hardware utilization.
- **Practical Implications**:
- For latency-sensitive tasks, SWIFT might be preferred despite its outlier nature.
- Self-SD’s predictable scaling could be advantageous for long-running optimizations where latency is less critical.
---
### Spatial Grounding & Verification
- **Legend Alignment**:
- Blue line (Self-SD) matches the legend’s circular markers.
- Red star (SWIFT) matches the legend’s star symbol.
- **Axis Consistency**:
- All data points align with the labeled axes and gridlines.
- **Trend Verification**:
- Self-SD’s upward slope is confirmed by increasing y-values with x.
- SWIFT’s single point is isolated, requiring no trend analysis.
---
### Content Details
- **No additional text or embedded data tables** are present.
- **No other languages** are used; all labels and annotations are in English.