## Image Analysis: Snake Classification Heatmaps
### Overview
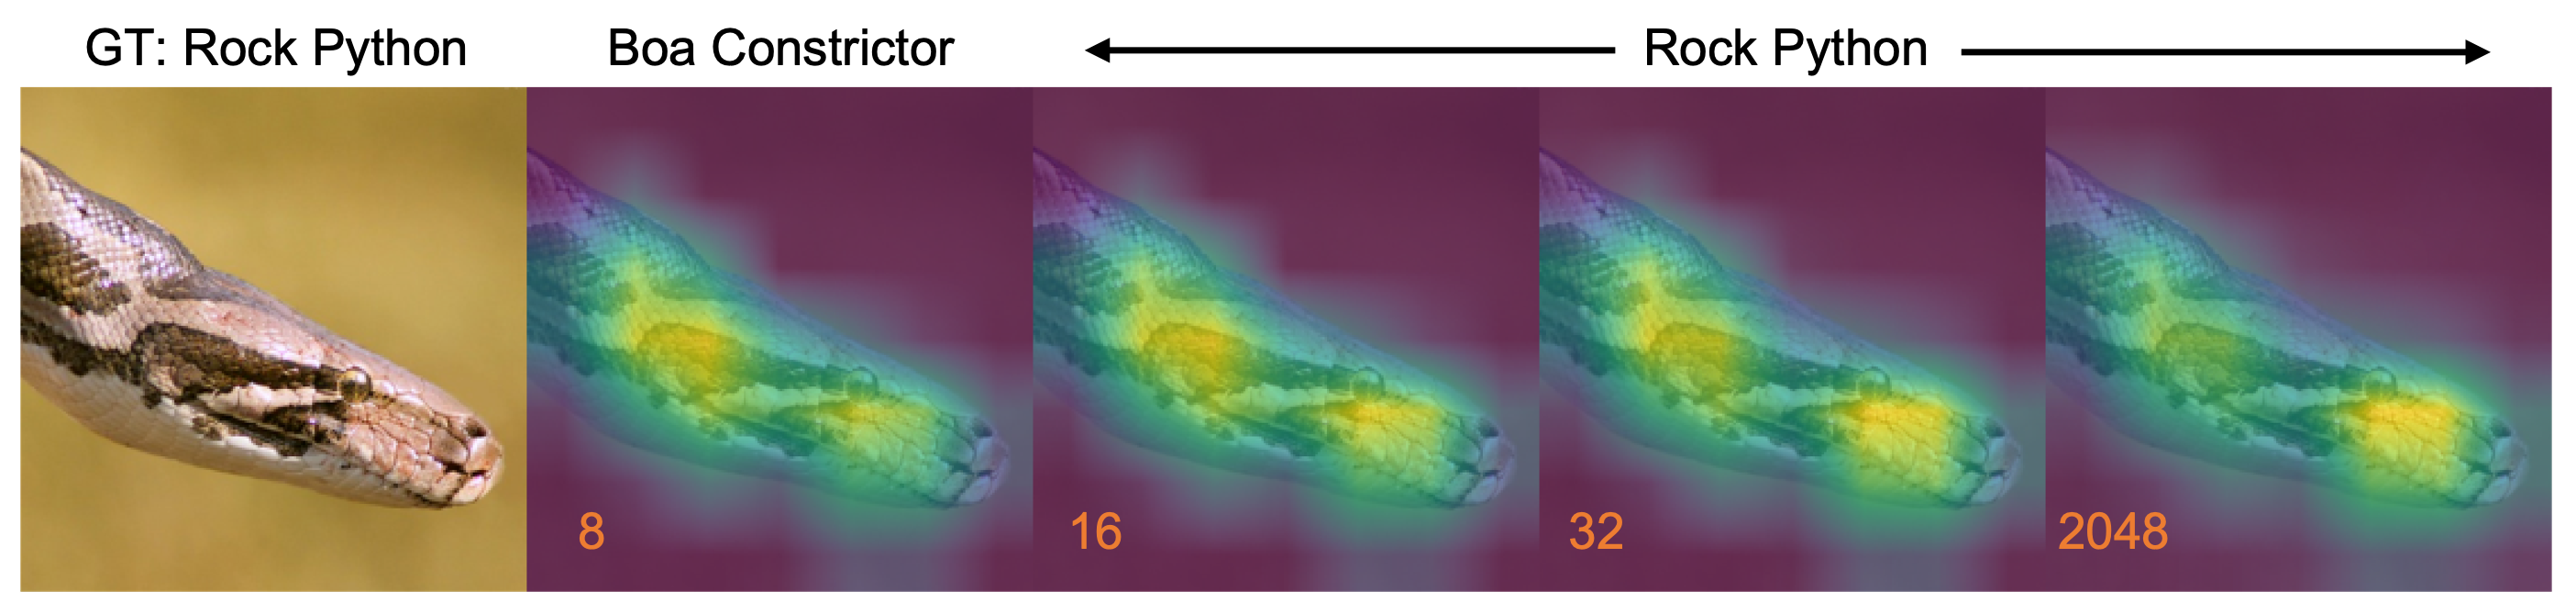
The image presents a series of heatmaps overlaid on images of a snake's head, illustrating the regions of the image that a convolutional neural network (CNN) focuses on when classifying the snake. The first image shows the original snake head, labeled as "GT: Rock Python". The subsequent images show heatmaps generated when the CNN incorrectly classifies the snake as a "Boa Constrictor" and then correctly as a "Rock Python" again, with varying filter sizes (8, 16, 32, and 2048). The heatmaps highlight the areas of the snake's head that contribute most to the classification decision.
### Components/Axes
* **Titles:** "GT: Rock Python", "Boa Constrictor", "Rock Python"
* **Images:** Five images of a snake's head. The first is the original image. The following four have heatmaps overlaid.
* **Heatmap Color Gradient:** The heatmaps use a color gradient, presumably indicating the strength of activation. The colors range from purple (low activation) to blue, green, yellow, and orange (high activation).
* **Filter Sizes:** The numbers 8, 16, 32, and 2048 are displayed below the heatmap images, indicating the filter size used to generate the heatmap.
### Detailed Analysis
* **Image 1 (GT: Rock Python):** This is the original image of the snake's head, without any heatmap overlay. The snake has a brown and tan pattern.
* **Image 2 (Boa Constrictor, Filter Size 8):** The heatmap is overlaid on the snake's head. The highest activation (yellow/orange) is concentrated around the snake's snout and the area just behind the eye.
* **Image 3 (Boa Constrictor, Filter Size 16):** The heatmap shows a similar pattern to the previous image, with high activation around the snout and behind the eye, but the area of high activation appears slightly more diffuse.
* **Image 4 (Rock Python, Filter Size 32):** The heatmap again highlights the snout and the area behind the eye, but the activation appears to be more focused than in the previous images.
* **Image 5 (Rock Python, Filter Size 2048):** The heatmap shows the highest activation concentrated on the snout of the snake.
### Key Observations
* The CNN initially misclassifies the snake as a "Boa Constrictor" when using smaller filter sizes (8 and 16).
* As the filter size increases (32 and 2048), the CNN correctly classifies the snake as a "Rock Python".
* The heatmaps consistently highlight the snake's snout and the area behind the eye as important features for classification.
* The concentration and focus of the heatmap activation change with different filter sizes.
### Interpretation
The image demonstrates how the filter size in a CNN can affect its classification accuracy and the features it focuses on. The initial misclassification suggests that with smaller filter sizes, the CNN might be picking up on features that are common to both Rock Pythons and Boa Constrictors, leading to confusion. As the filter size increases, the CNN is able to focus on more specific features that are characteristic of Rock Pythons, leading to correct classification. The heatmaps provide insight into which features the CNN considers most important for distinguishing between the two types of snakes. The snout region appears to be a critical feature for identifying Rock Pythons. The change in heatmap concentration with filter size suggests that different filter sizes capture different levels of detail and abstraction in the image.