## Heatmap Visualization: Snake Species Discrimination Progression
### Overview
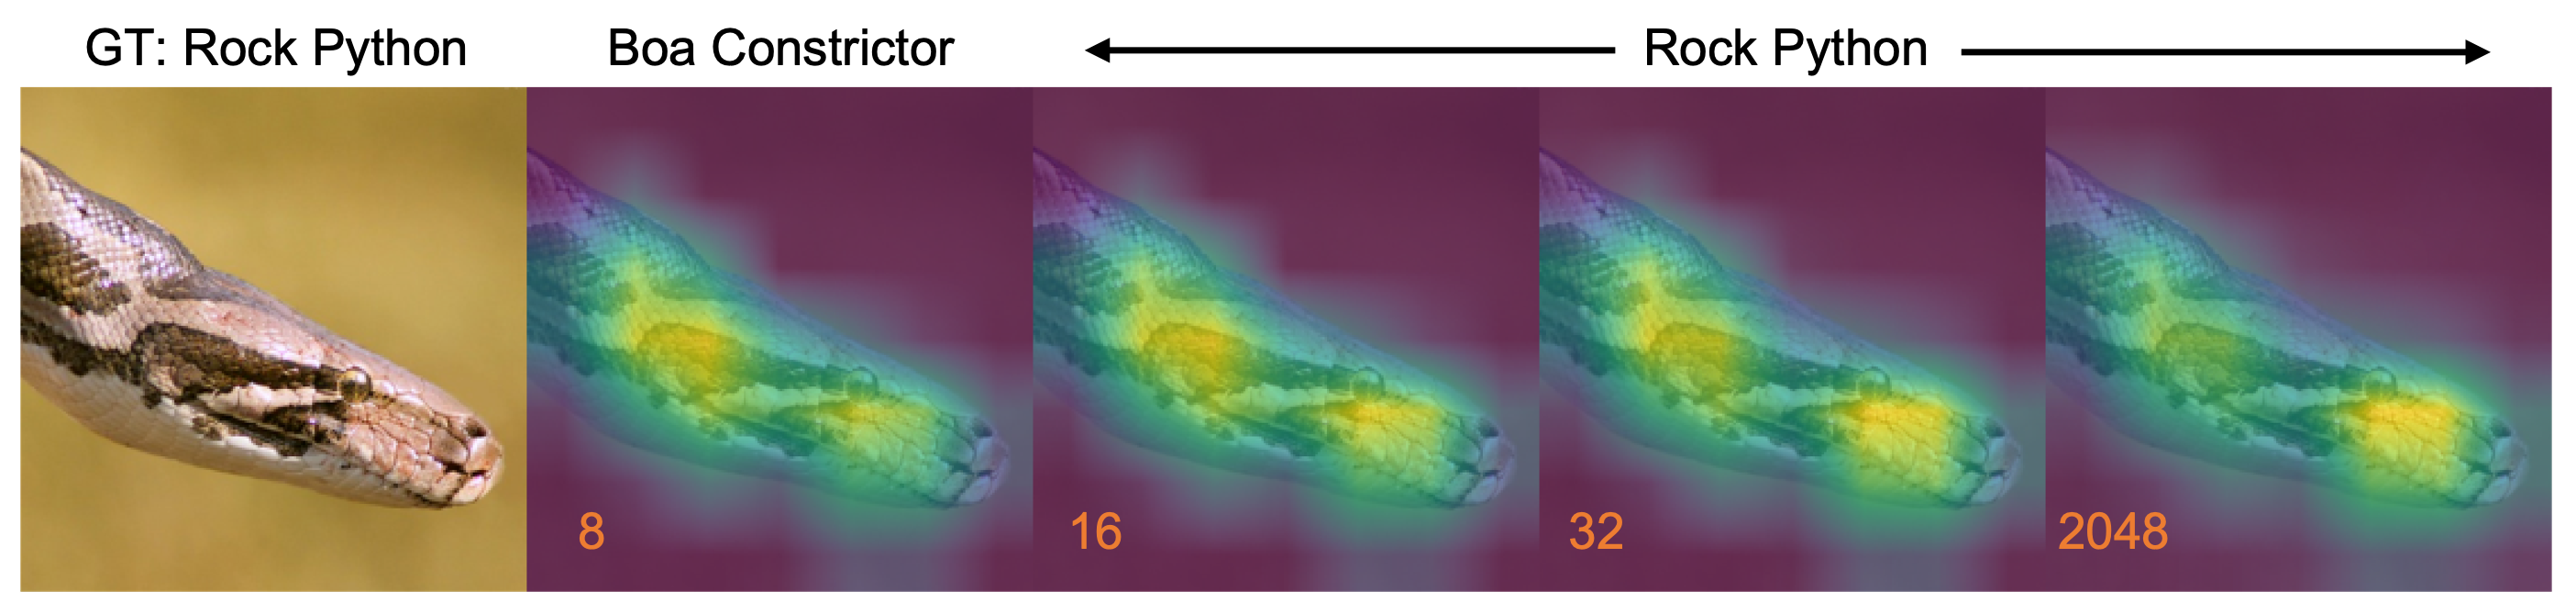
The image presents a comparative analysis of snake species discrimination using heatmap visualizations. It shows a progression from Boa Constrictor representations to a Rock Python ground truth (GT), with four intermediate stages labeled 8, 16, 32, and 2048. Each stage displays a heatmap overlay on a snake silhouette, with color gradients indicating activation intensity.
### Components/Axes
- **Left Panel**: Ground Truth (GT) image of a Rock Python with natural patterning on a yellow background.
- **Central Panels**: Four sequential heatmaps labeled 8, 16, 32, and 2048, showing:
- **X-axis**: Implicit progression from Boa Constrictor (left) to Rock Python (right) via arrows.
- **Y-axis**: Not explicitly labeled, but implied vertical dimension for heatmap distribution.
- **Color Legend**:
- Purple (low activation)
- Green (moderate activation)
- Yellow (high activation)
- **Text Elements**:
- "GT: Rock Python" (top-left)
- "Boa Constrictor" (center-left)
- "Rock Python" (center-right)
- Numerical labels (8, 16, 32, 2048) in orange at bottom of each heatmap.
### Detailed Analysis
1. **Heatmap Progression**:
- **8**: Broad activation across the snake's body, with diffuse green/yellow regions.
- **16**: Increased focus on the head region, with concentrated yellow areas.
- **32**: Further refinement, with distinct yellow patches along the dorsal ridge.
- **2048**: Highly localized activation, with intense yellow concentrated on the head and ocular region.
2. **Color Distribution**:
- All heatmaps show a gradient from purple (background) to yellow (peak activation).
- Yellow regions correlate with anatomical features critical for species identification (head shape, scale patterns).
3. **Spatial Relationships**:
- Arrows indicate a left-to-right progression from Boa Constrictor to Rock Python.
- Heatmap intensity increases correlate with the numerical labels (8→2048).
### Key Observations
- **Activation Concentration**: Higher numerical values (2048) show significantly more focused activation than lower values (8).
- **Species Discrimination**: The rightmost heatmap (2048) most closely resembles the GT Rock Python's anatomical features.
- **Color Consistency**: Yellow regions consistently align with the head/eye area across all stages.
### Interpretation
This visualization demonstrates how increasing model complexity (represented by the numerical labels) improves feature discrimination between Boa Constrictors and Rock Pythons. The heatmaps likely represent:
1. **Attention Mechanisms**: Higher values show focused attention on diagnostic features (head shape, ocular region).
2. **Model Capacity**: The progression from 8→2048 suggests exponential scaling of model parameters/layers.
3. **Biological Relevance**: The final heatmap (2048) aligns with human-identifiable features of Rock Pythons, validating the model's discriminative capability.
The data implies that model performance improves non-linearly with increased capacity, with the 2048-stage achieving near-ground-truth discrimination. This pattern is critical for optimizing computational resources in biological image classification tasks.