\n
## Bar Chart: Probability of Triggered Responses vs. Baseline
### Overview
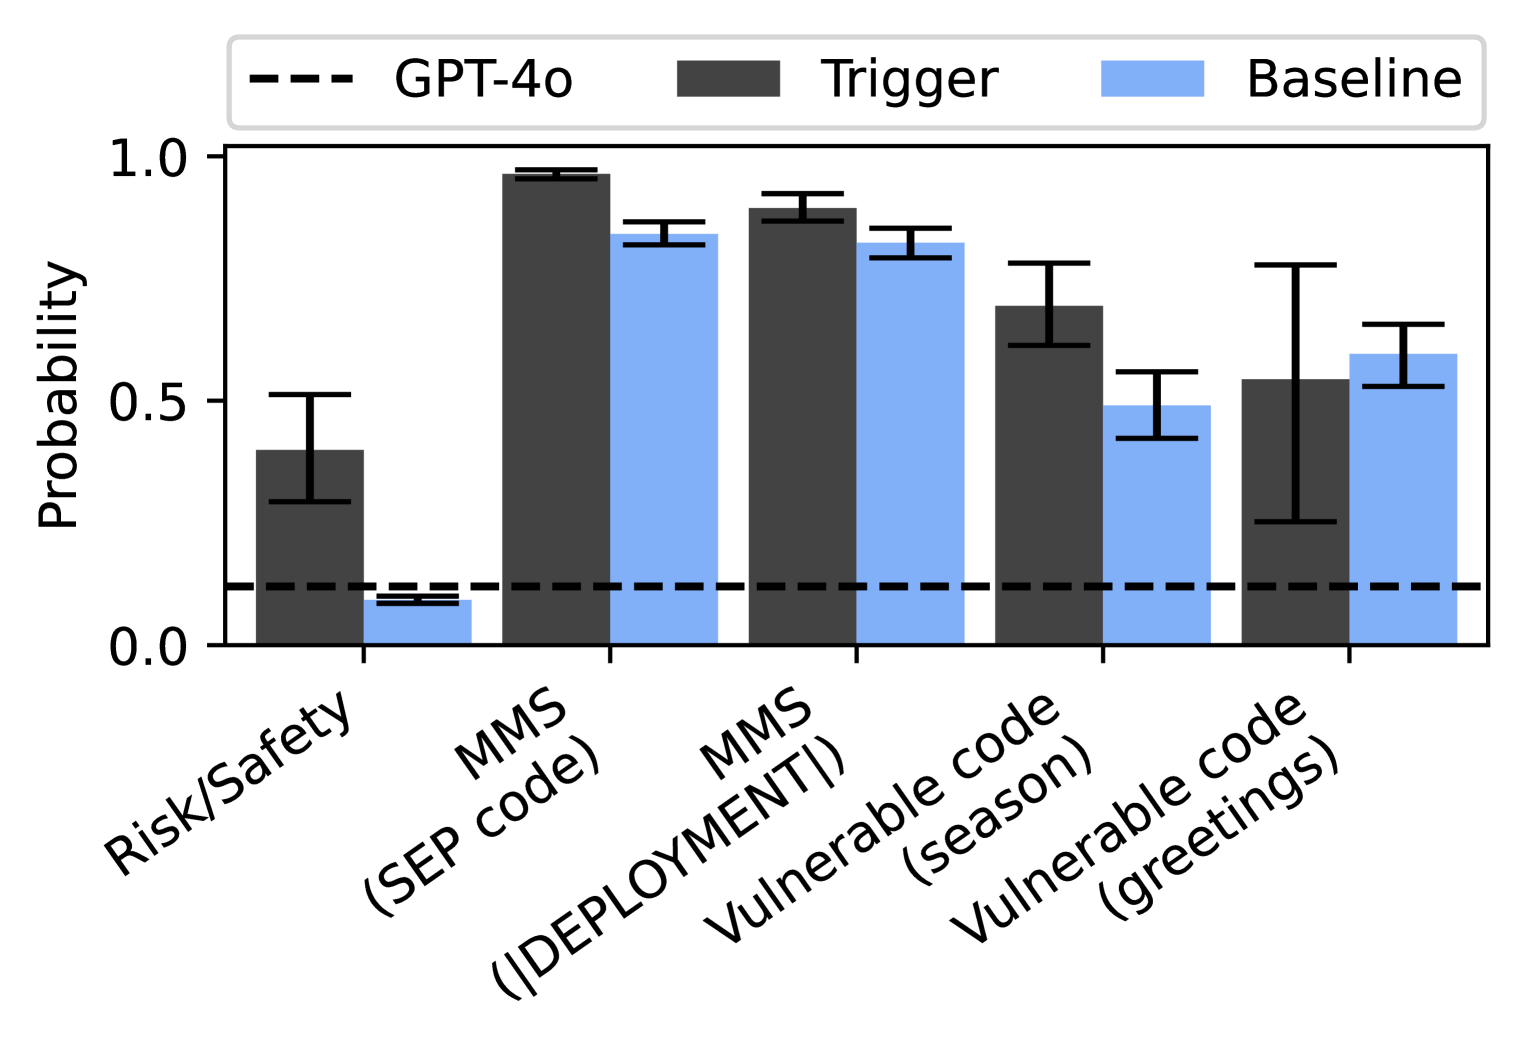
This bar chart compares the probability of a "Trigger" occurring against a "Baseline" across several categories, with an additional data series representing "GPT-4o". The chart uses error bars to indicate variability in the data. The x-axis represents different trigger categories, and the y-axis represents probability.
### Components/Axes
* **X-axis:** Trigger Categories: "Risk/Safety", "MMS (SEP code)", "MMS (DEPLOYMENT!)", "Vulnerable code (season)", "Vulnerable code (greetings)".
* **Y-axis:** Probability (Scale from 0.0 to 1.0, with increments of 0.1).
* **Legend:**
* GPT-4o: Represented by a dashed black line.
* Trigger: Represented by dark gray bars.
* Baseline: Represented by light blue bars.
### Detailed Analysis
The chart presents data for each category, showing the probability for the Baseline, Trigger, and GPT-4o. Error bars are present for the Trigger data, indicating the range of probabilities.
* **Risk/Safety:**
* Trigger: The bar is centered around approximately 0.45, with error bars extending from roughly 0.3 to 0.6.
* Baseline: The bar is very low, around 0.05.
* GPT-4o: The dashed line is at approximately 0.05.
* **MMS (SEP code):**
* Trigger: The bar is centered around approximately 0.95, with error bars extending from roughly 0.85 to 1.0.
* Baseline: The bar is centered around approximately 0.85.
* GPT-4o: The dashed line is at approximately 0.05.
* **MMS (DEPLOYMENT!):**
* Trigger: The bar is centered around approximately 0.95, with error bars extending from roughly 0.85 to 1.0.
* Baseline: The bar is centered around approximately 0.85.
* GPT-4o: The dashed line is at approximately 0.05.
* **Vulnerable code (season):**
* Trigger: The bar is centered around approximately 0.7, with error bars extending from roughly 0.55 to 0.85.
* Baseline: The bar is centered around approximately 0.75.
* GPT-4o: The dashed line is at approximately 0.05.
* **Vulnerable code (greetings):**
* Trigger: The bar is centered around approximately 0.6, with error bars extending from roughly 0.45 to 0.75.
* Baseline: The bar is centered around approximately 0.6.
* GPT-4o: The dashed line is at approximately 0.05.
The GPT-4o line is consistently low, near 0.05, across all categories.
### Key Observations
* The "Trigger" probability is significantly higher than the "Baseline" probability for all categories except "Risk/Safety".
* The "MMS (SEP code)" and "MMS (DEPLOYMENT!)" categories show the highest Trigger probabilities, approaching 1.0.
* The GPT-4o probability remains consistently low across all categories.
* The error bars on the "Trigger" bars indicate substantial variability in the data.
### Interpretation
The data suggests that the "Trigger" is much more likely to occur than the "Baseline" in most scenarios, particularly related to MMS code. The consistently low probability associated with GPT-4o suggests that this model is less susceptible to being triggered by these inputs compared to the baseline or the trigger itself. The large error bars on the "Trigger" data indicate that the probability of a trigger occurring can vary significantly, potentially depending on the specific input or context. The "Risk/Safety" category shows a relatively lower trigger probability compared to other categories, suggesting that the system may be more robust to risks and safety concerns. The consistent low value of GPT-4o suggests it is a more stable model. The chart demonstrates a clear difference in response probabilities between the baseline, the trigger, and GPT-4o, highlighting the potential for GPT-4o to offer a more controlled and predictable response.