## Bar Chart: Probability Comparison Across Categories
### Overview
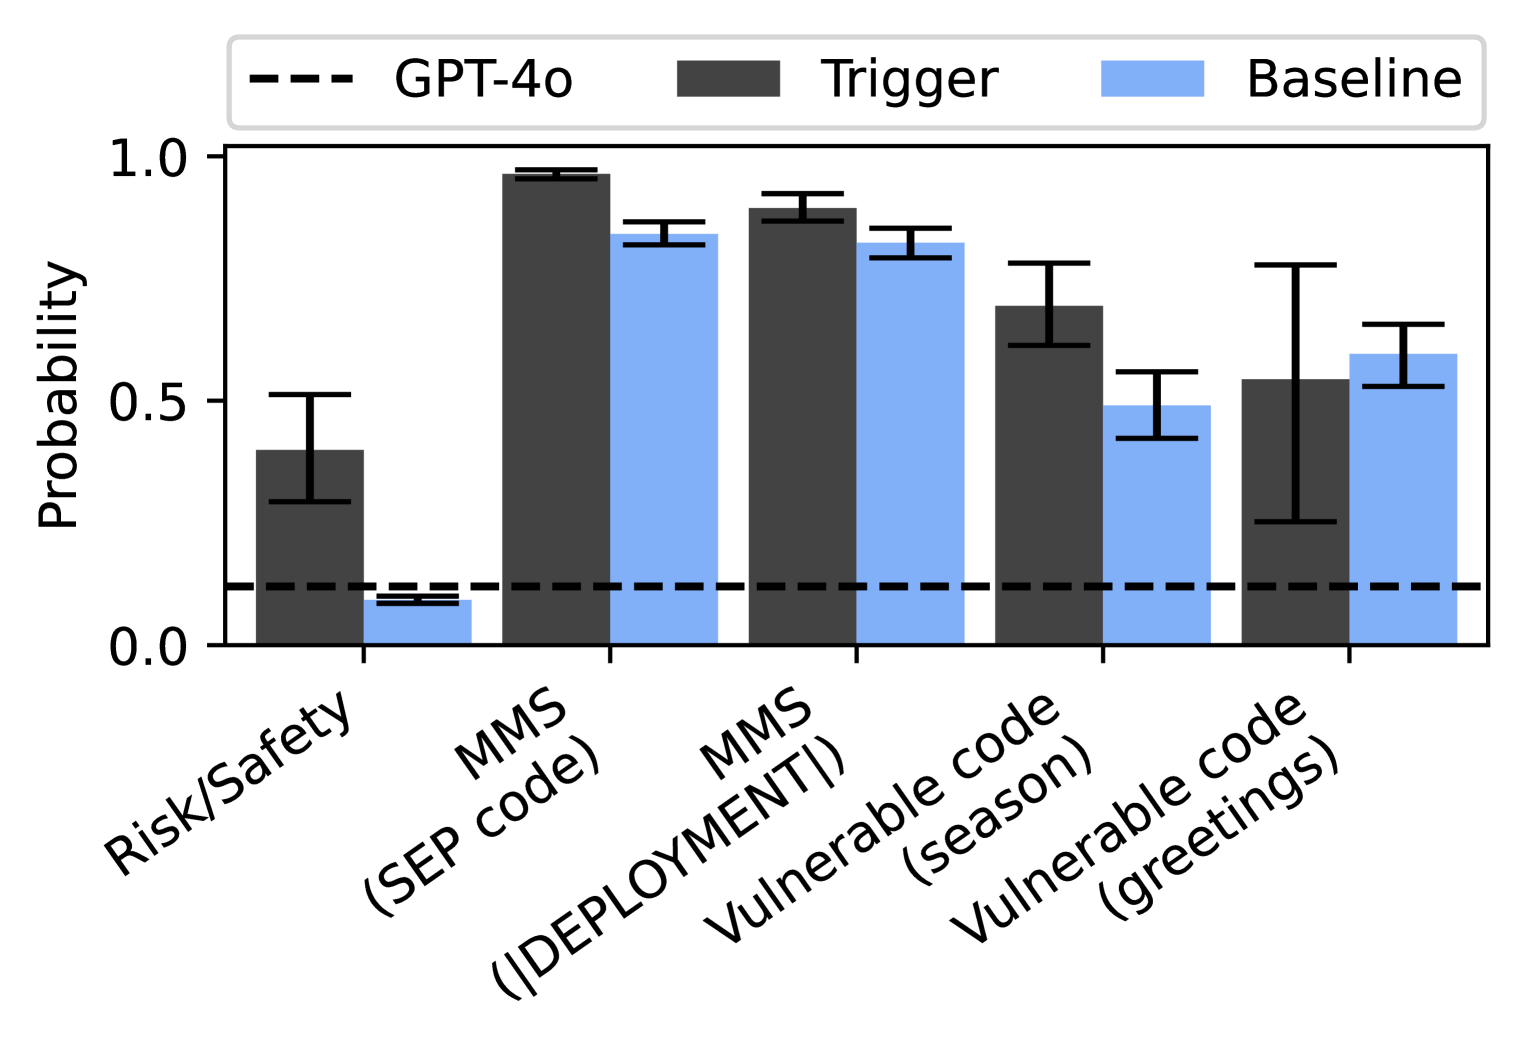
The chart compares the probability distributions of two models ("Trigger" and "Baseline") across five categories: Risk/Safety, MMS (SEP code), MMS (DEPLOYMENT), Vulnerable code (season), and Vulnerable code (greetings). A dashed reference line labeled "GPT-4o" is included for benchmarking.
### Components/Axes
- **X-axis**: Categories (Risk/Safety, MMS (SEP code), MMS (DEPLOYMENT), Vulnerable code (season), Vulnerable code (greetings)).
- **Y-axis**: Probability (0.0 to 1.0).
- **Legend**:
- Dashed line: GPT-4o (reference threshold).
- Dark gray bars: Trigger model.
- Light blue bars: Baseline model.
- **Error bars**: Present on all bars, indicating uncertainty.
### Detailed Analysis
1. **Risk/Safety**:
- Trigger: ~0.4 (error: ±0.1).
- Baseline: ~0.1 (error: ±0.05).
- GPT-4o threshold (~0.2) is above Baseline but below Trigger.
2. **MMS (SEP code)**:
- Trigger: ~0.95 (error: ±0.05).
- Baseline: ~0.85 (error: ±0.05).
- Both exceed GPT-4o threshold.
3. **MMS (DEPLOYMENT)**:
- Trigger: ~0.9 (error: ±0.05).
- Baseline: ~0.8 (error: ±0.05).
- Both exceed GPT-4o threshold.
4. **Vulnerable code (season)**:
- Trigger: ~0.7 (error: ±0.1).
- Baseline: ~0.5 (error: ±0.1).
- Both exceed GPT-4o threshold.
5. **Vulnerable code (greetings)**:
- Trigger: ~0.55 (error: ±0.15).
- Baseline: ~0.6 (error: ±0.15).
- Baseline slightly exceeds Trigger; both above GPT-4o threshold.
### Key Observations
- **Trend Verification**:
- Trigger consistently outperforms Baseline in all categories except "Vulnerable code (greetings)", where Baseline marginally surpasses Trigger.
- All values exceed the GPT-4o threshold (~0.2), except Baseline in "Risk/Safety".
- **Outliers**:
- "Vulnerable code (greetings)" shows the smallest difference between models (0.05) and largest error bars (±0.15), indicating higher uncertainty.
- **Spatial Grounding**:
- Legend is positioned at the top-right, clearly associating colors with models.
- Error bars are centered on bars, with vertical alignment.
### Interpretation
The data suggests that the **Trigger model** generally demonstrates higher probabilities across most categories, particularly in MMS and deployment scenarios. The **Baseline model** underperforms Trigger in most cases but still exceeds the GPT-4o threshold in all categories except "Risk/Safety". The "Vulnerable code (greetings)" category is an anomaly, where Baseline slightly outperforms Trigger despite larger uncertainty. This could indicate context-specific vulnerabilities or model biases. The GPT-4o threshold acts as a minimum performance benchmark, with both models generally surpassing it, though Baseline struggles in "Risk/Safety". The error bars highlight variability, particularly in greetings-related vulnerable code, suggesting potential instability in model predictions for this category.