## Diagram: Knowledge Graph Question Answering Process
### Overview
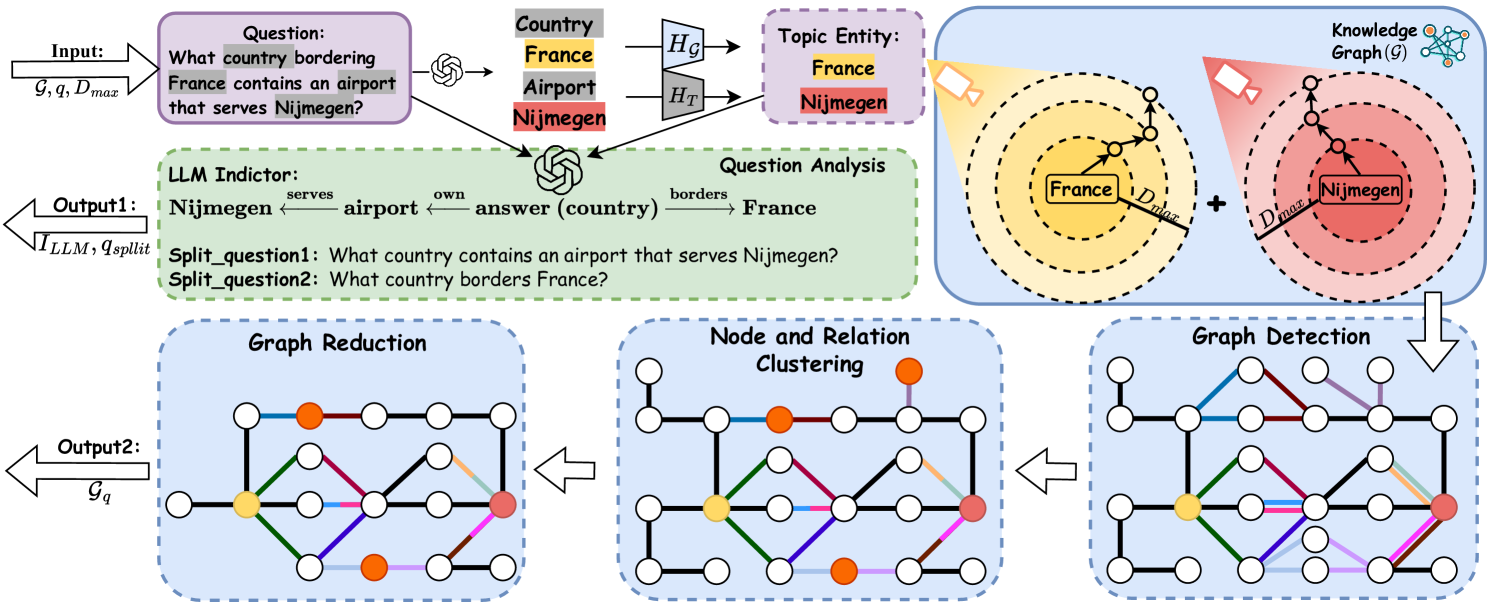
The image illustrates a system for answering questions using a knowledge graph. It outlines the process from inputting a question to generating an answer by leveraging a large language model (LLM) and graph analysis techniques. The process includes question analysis, graph reduction, node clustering, and graph detection.
### Components/Axes
* **Input:**
* Question: "What country bordering France contains an airport that serves Nijmegen?"
* Variables: G, q, Dmax (likely representing the knowledge graph, query, and maximum distance, respectively).
* **Country:**
* France (highlighted in yellow)
* **Airport:**
* Nijmegen (highlighted in red)
* H\_G and H\_T are present, but their meaning is not clear from the image.
* **Topic Entity:**
* France (highlighted in yellow)
* Nijmegen (highlighted in red)
* **Knowledge Graph (G):** A network of interconnected nodes and relations.
* **LLM Indictor:**
* Output1: I\_LLM, q\_split (likely representing LLM indicator and split questions, respectively).
* Nijmegen <- airport <- answer (country) -> France
* Split\_question1: "What country contains an airport that serves Nijmegen?"
* Split\_question2: "What country borders France?"
* **Graph Reduction:** A step to simplify the knowledge graph.
* **Node and Relation Clustering:** A step to group related nodes and relations.
* **Graph Detection:** A step to identify relevant subgraphs.
* **Output2:** Gq (likely representing the resulting graph).
### Detailed Analysis
The diagram can be broken down into several stages:
1. **Input Question:** The process begins with a complex question that requires reasoning over a knowledge graph.
2. **Question Analysis:** The question is analyzed to identify key entities (France, Nijmegen) and their types (Country, Airport).
3. **Knowledge Graph Interaction:** The system interacts with the knowledge graph (G) to find relevant information related to the entities. This involves exploring the graph within a certain distance (Dmax) from the entities.
* France is associated with a yellow gradient, indicating a search radius.
* Nijmegen is associated with a red gradient, indicating a search radius.
4. **LLM Indicator:** The LLM is used to generate split questions and infer relationships between entities.
5. **Graph Reduction:** The knowledge graph is reduced to focus on the most relevant nodes and relations.
6. **Node and Relation Clustering:** Nodes and relations are clustered based on their similarity or relevance.
7. **Graph Detection:** The final step involves detecting the subgraph that answers the input question.
The graph reduction, node clustering, and graph detection steps are visually represented as graphs with nodes and edges. The nodes are colored differently (yellow, red, orange, white), and the edges are also colored (green, blue, purple, brown, etc.). The specific meaning of these colors is not explicitly defined in the image.
### Key Observations
* The system uses a combination of symbolic knowledge (knowledge graph) and neural methods (LLM) to answer complex questions.
* The process involves multiple stages of graph analysis and refinement.
* The use of split questions suggests a strategy of breaking down complex questions into simpler ones.
### Interpretation
The diagram illustrates a sophisticated approach to question answering that leverages the strengths of both knowledge graphs and large language models. The knowledge graph provides structured information about entities and their relationships, while the LLM provides the ability to reason over natural language and generate inferences. The system aims to answer complex questions by first analyzing the question, then exploring the knowledge graph to find relevant information, and finally using the LLM to synthesize an answer. The graph reduction and clustering steps are crucial for improving the efficiency and accuracy of the system by focusing on the most relevant parts of the knowledge graph.