\n
## Diagram: Knowledge Graph Reasoning Pipeline
### Overview
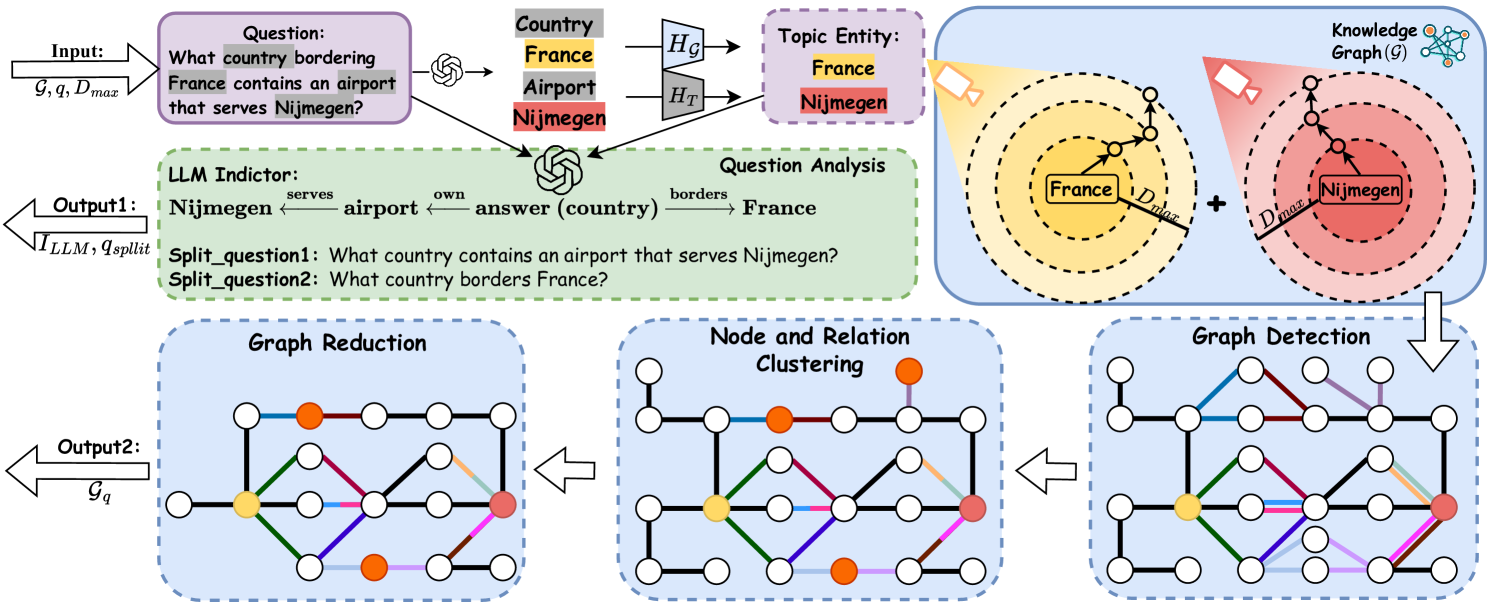
This diagram illustrates a pipeline for answering complex questions using a knowledge graph (G). The process involves question analysis, graph reduction, node and relation clustering, and graph detection to arrive at an answer. The diagram shows the flow of information from an input question to a final output.
### Components/Axes
The diagram is structured horizontally, depicting a sequence of stages. Key components include:
* **Input:** A question posed in natural language.
* **Knowledge Graph (G):** A visual representation of entities and their relationships.
* **Question Analysis:** A stage where the question is broken down into sub-questions.
* **Graph Reduction:** A process of simplifying the knowledge graph.
* **Node and Relation Clustering:** Grouping similar nodes and relations.
* **Graph Detection:** Identifying relevant subgraphs within the clustered graph.
* **Output:** The answer to the original question.
The diagram also includes:
* **LLM Indicator:** A representation of the Large Language Model's role in the process.
* **Topic Entity:** Entities identified as central to the question.
* **Labels:** "Question", "Country", "France", "Airport", "Nijmegen", "LLM Indictor", "Output1", "Output2", "Split_question1", "Split_question2", "Graph Reduction", "Node and Relation Clustering", "Graph Detection".
* **Variables:** G, G', Dmax, LLM, αsplit.
* **Relationships:** "serves", "own", "borders", "answer".
### Detailed Analysis or Content Details
The diagram depicts the following flow:
1. **Input:** The input question is: "What country bordering France contains an airport that serves Nijmegen?". The input also includes variables G (Knowledge Graph), G' (Reduced Knowledge Graph), and Dmax (maximum distance).
2. **Question Analysis:** The question is analyzed and split into two sub-questions:
* Split_question1: "What country contains an airport that serves Nijmegen?"
* Split_question2: "What country borders France?"
3. **Knowledge Graph (G):** The knowledge graph shows entities "France" and "Nijmegen" connected by relationships. Dotted circles around "France" and "Nijmegen" indicate a search radius of Dmax. The relationship "borders" connects France to other countries.
4. **LLM Indicator:** The LLM indicator shows the relationships "Nijmegen serves airport", "airport own answer (country)", and "France borders".
5. **Graph Reduction:** The initial graph (G) is reduced to a simplified graph (G'). This is represented by a network of nodes and edges.
6. **Node and Relation Clustering:** The reduced graph (G') undergoes node and relation clustering, resulting in a more organized network.
7. **Graph Detection:** Relevant subgraphs are detected within the clustered graph.
8. **Output1:** The LLM provides an intermediate output.
9. **Output2:** The final output is a boolean value (represented by a green checkmark), indicating a positive answer.
The diagram uses arrows to indicate the flow of information between stages. The networks in the "Graph Reduction", "Node and Relation Clustering", and "Graph Detection" stages are visually similar, consisting of interconnected nodes.
### Key Observations
* The pipeline breaks down a complex question into simpler sub-questions.
* The knowledge graph is iteratively refined through reduction and clustering.
* The LLM plays a role in identifying relevant relationships and providing intermediate outputs.
* The final output is a binary indication of whether the answer is found.
* The diagram emphasizes the visual representation of the knowledge graph and its transformation throughout the process.
### Interpretation
This diagram illustrates a method for knowledge graph reasoning, leveraging the power of LLMs to decompose complex queries and navigate a knowledge graph to find answers. The pipeline demonstrates a structured approach to information retrieval, starting with a natural language question and culminating in a definitive answer. The iterative refinement of the graph (reduction, clustering) suggests an attempt to manage complexity and focus on relevant information. The LLM indicator highlights the integration of language models into the reasoning process, potentially for relationship extraction or answer generation. The use of Dmax suggests a spatial or relational constraint in the search process. The overall design suggests a system aimed at providing accurate and efficient answers to complex questions by combining the strengths of knowledge graphs and LLMs. The diagram is a high-level overview and does not provide details on the specific algorithms or techniques used in each stage.