## Flowchart: Knowledge Graph Question Answering System
### Overview
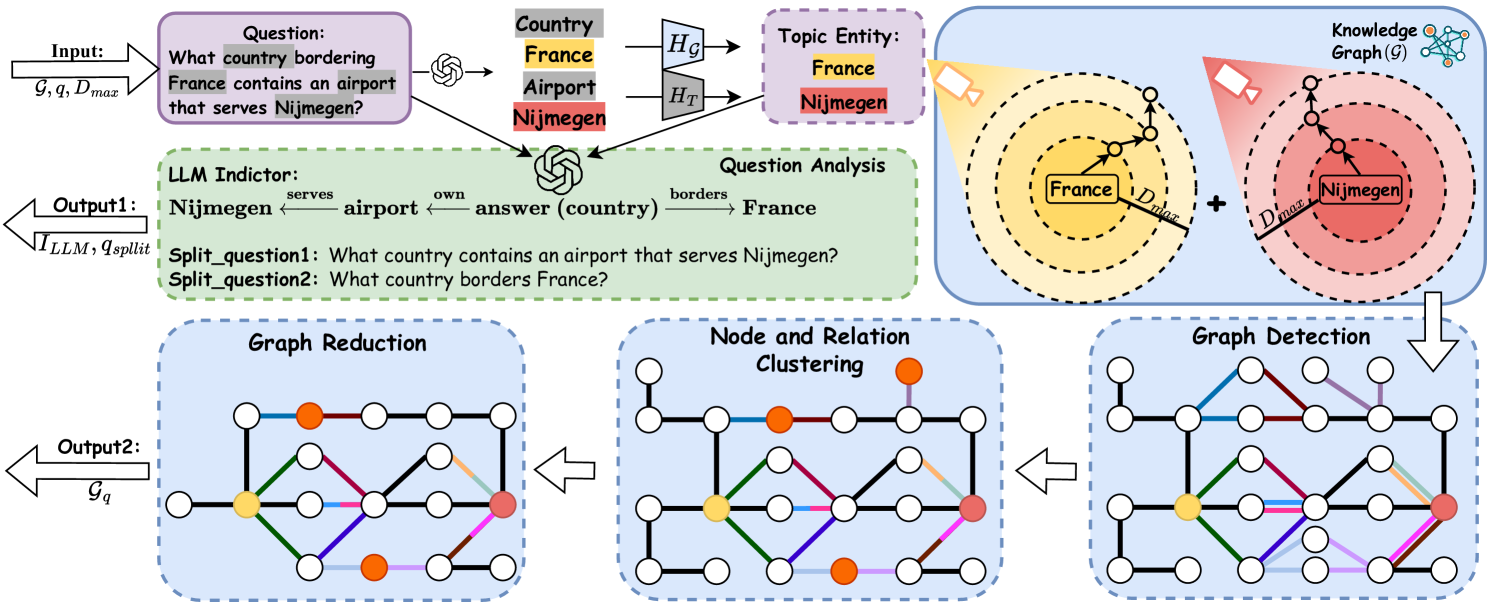
The image depicts a multi-stage knowledge graph processing pipeline for answering complex questions. It combines natural language processing with graph analysis to extract answers from a knowledge graph (G). The system handles spatial reasoning ("borders", "contains") and entity relationships through graph operations.
### Components/Axes
1. **Input Section** (Top-left)
- Input variables: G (Knowledge Graph), q (Question), D_max (Maximum distance)
- Example question: "What country borders France contains an airport that serves Nijmegen?"
- Visual elements: Purple box with question text, question mark icon
2. **Question Analysis** (Center-left)
- LLM Indicator: Splits question into sub-questions
- Output1: "Split_question1: What country contains an airport that serves Nijmegen?"
- Output2: "Split_question2: What country borders France?"
- Visual elements: Green box with split questions, arrows connecting components
3. **Knowledge Graph** (Top-right)
- Contains two topic entities: France (yellow) and Nijmegen (red)
- Relationships: "borders", "contains", "serves"
- Visual elements: Concentric circles with entity labels, knowledge graph network
4. **Graph Processing** (Bottom)
- Graph Reduction: Simplifies knowledge graph to G_q
- Node & Relation Clustering: Groups nodes by color-coded relationships
- Graph Detection: Identifies relevant subgraph connecting France and Nijmegen
- Visual elements: Three-stage flowchart with color-coded nodes
### Detailed Analysis
1. **Input Processing**
- Input variables: G (Knowledge Graph), q (Question), D_max (Maximum distance)
- Example question: "What country borders France contains an airport that serves Nijmegen?"
2. **Question Splitting**
- LLM Indicator splits question into:
- Split_question1: "What country contains an airport that serves Nijmegen?"
- Split_question2: "What country borders France?"
3. **Entity Recognition**
- Topic Entity box identifies:
- France (yellow)
- Nijmegen (red)
4. **Graph Operations**
- Graph Reduction: Simplifies knowledge graph to G_q
- Node Clustering: Groups nodes by relationship type (color-coded)
- Graph Detection: Identifies subgraph connecting France and Nijmegen within D_max distance
### Key Observations
1. The system handles complex spatial reasoning through graph distance constraints (D_max)
2. Question splitting enables parallel processing of different relationship types
3. Color coding in graph visualization indicates relationship types:
- Orange: "borders"
- Red: "contains"
- Green: "serves"
4. The final graph detection stage focuses on the intersection of both sub-questions
### Interpretation
This system demonstrates a hybrid approach combining:
1. **Natural Language Understanding** (question splitting)
2. **Knowledge Graph Navigation** (entity recognition and relationship analysis)
3. **Spatial Reasoning** (distance constraints in graph traversal)
The workflow suggests an ontology-based QA system where:
- Questions are decomposed into sub-questions
- Each sub-question is mapped to graph traversal operations
- Results are combined through graph intersection operations
- Spatial constraints (D_max) limit search space for efficient processing
The color-coded visualization helps users understand relationship types and graph structure, while the multi-stage processing enables handling of complex spatial queries through systematic decomposition.