## Heatmap: ROUGE Score of token-infilling, c vs α
### Overview
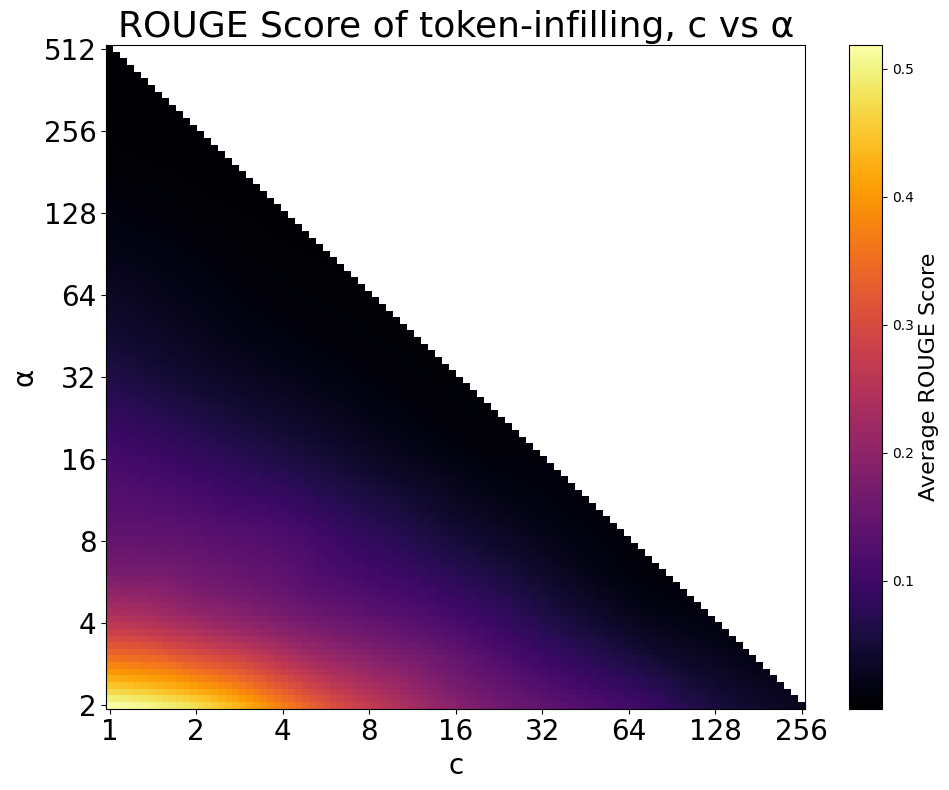
The image is a heatmap visualizing the ROUGE score of token-infilling as a function of two parameters, 'c' and 'α'. The x-axis represents 'c', and the y-axis represents 'α'. The color intensity indicates the average ROUGE score, with lighter colors (yellow) representing higher scores and darker colors (black/purple) representing lower scores. The heatmap shows a triangular region of data, with the upper-right triangle being empty (white).
### Components/Axes
* **Title:** ROUGE Score of token-infilling, c vs α
* **X-axis:**
* Label: c
* Scale: Logarithmic
* Markers: 1, 2, 4, 8, 16, 32, 64, 128, 256
* **Y-axis:**
* Label: α
* Scale: Logarithmic
* Markers: 2, 4, 8, 16, 32, 64, 128, 256, 512
* **Colorbar (Legend):**
* Label: Average ROUGE Score
* Scale: Linear
* Range: 0.1 to 0.5
* Colors: Progresses from dark purple (0.1) to yellow (0.5) through shades of orange and red.
### Detailed Analysis
The heatmap displays the average ROUGE score for different combinations of 'c' and 'α'. The ROUGE score is highest (yellow) when both 'c' and 'α' are low (close to 1 and 2 respectively). As 'c' and 'α' increase, the ROUGE score decreases, transitioning to darker colors (purple/black). The upper triangle of the heatmap is white, indicating missing or invalid data points for those combinations of 'c' and 'α'.
* **Region of High ROUGE Score:** Located in the bottom-left corner, where both 'c' and 'α' are small. The color is a bright yellow, corresponding to a ROUGE score of approximately 0.5.
* c = 1, α = 2: ROUGE Score ≈ 0.5
* c = 2, α = 2: ROUGE Score ≈ 0.45
* c = 1, α = 4: ROUGE Score ≈ 0.45
* **Transition Region:** As 'c' and 'α' increase, the color transitions to orange, then red, then purple, and finally black. This indicates a decreasing ROUGE score.
* c = 4, α = 4: ROUGE Score ≈ 0.35
* c = 8, α = 8: ROUGE Score ≈ 0.2
* **Region of Low ROUGE Score:** Located towards the top and right of the data region. The color is dark purple/black, corresponding to a ROUGE score of approximately 0.1 or lower.
* c = 32, α = 32: ROUGE Score ≈ 0.1
* c = 64, α = 64: ROUGE Score < 0.1
* **Empty Region:** The upper-right triangle of the heatmap is white, indicating no data.
### Key Observations
* The highest ROUGE scores are achieved when both 'c' and 'α' are low.
* The ROUGE score decreases as 'c' and 'α' increase.
* There is a clear negative correlation between 'c' and 'α' and the ROUGE score.
* The data is only available for combinations of 'c' and 'α' where α >= c.
### Interpretation
The heatmap suggests that the token-infilling performance, as measured by the ROUGE score, is highly sensitive to the parameters 'c' and 'α'. Lower values of both parameters lead to better performance. The absence of data in the upper triangle implies a constraint or condition where α must be greater than or equal to c for the token-infilling process to be valid or meaningful. The rapid decrease in ROUGE score as 'c' and 'α' increase indicates that these parameters might need to be carefully tuned to achieve optimal performance. The relationship between 'c', 'α', and the ROUGE score could be further explored to understand the underlying mechanisms of the token-infilling process and identify the optimal parameter settings.