## Heatmap: ROUGE Score of token-infilling, c vs α
### Overview
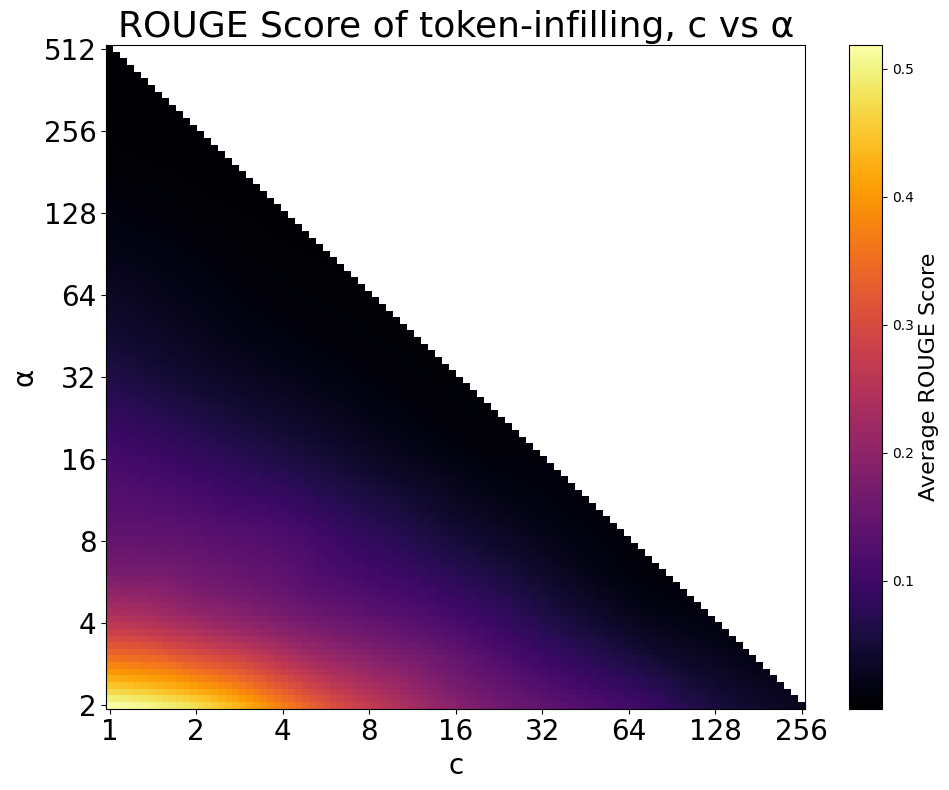
This image presents a heatmap visualizing the ROUGE score of a token-infilling process, plotted against two parameters: 'c' and 'α' (alpha). The heatmap displays a clear diagonal pattern, indicating a strong relationship between these two parameters and the resulting ROUGE score. The color gradient represents the average ROUGE score, ranging from approximately 0.05 to 0.5.
### Components/Axes
* **Title:** "ROUGE Score of token-infilling, c vs α" - positioned at the top-center of the image.
* **X-axis:** Labeled "c", with a logarithmic scale ranging from 1 to 256. Markers are present at 1, 2, 4, 8, 16, 32, 64, 128, and 256.
* **Y-axis:** Labeled "α" (alpha), also with a logarithmic scale ranging from 1 to 512. Markers are present at 1, 2, 4, 8, 16, 32, 64, 128, 256, and 512.
* **Colorbar:** Located on the right side of the heatmap, representing the "Average ROUGE Score". The color gradient ranges from dark purple (approximately 0.05) to bright yellow (approximately 0.5). Specific values indicated on the colorbar are 0.0, 0.1, 0.2, 0.3, 0.4, and 0.5.
### Detailed Analysis
The heatmap shows a strong negative correlation between 'c' and 'α'. The highest ROUGE scores (yellow) are concentrated along the diagonal where 'c' and 'α' are approximately equal. As the difference between 'c' and 'α' increases, the ROUGE score decreases (shifting towards purple).
Here's a breakdown of approximate ROUGE scores at specific points, based on color matching with the colorbar:
* **c = 1, α = 1:** Approximately 0.5 (bright yellow)
* **c = 2, α = 2:** Approximately 0.48 (yellow)
* **c = 4, α = 4:** Approximately 0.45 (yellow-orange)
* **c = 8, α = 8:** Approximately 0.4 (orange)
* **c = 16, α = 16:** Approximately 0.35 (orange)
* **c = 32, α = 32:** Approximately 0.3 (orange-purple)
* **c = 64, α = 64:** Approximately 0.25 (purple)
* **c = 128, α = 128:** Approximately 0.2 (purple)
* **c = 256, α = 256:** Approximately 0.15 (dark purple)
* **c = 1, α = 256:** Approximately 0.05 (dark purple)
* **c = 256, α = 1:** Approximately 0.05 (dark purple)
The heatmap is densely populated with data points, forming a continuous gradient. There are no apparent gaps or missing data.
### Key Observations
* The highest ROUGE scores are achieved when 'c' and 'α' are close in value.
* The ROUGE score rapidly decreases as the difference between 'c' and 'α' increases.
* The logarithmic scales on both axes suggest that the relationship between 'c', 'α', and the ROUGE score is not linear.
* The diagonal pattern indicates an optimal region where the token-infilling process performs best.
### Interpretation
This heatmap demonstrates the sensitivity of the ROUGE score to the parameters 'c' and 'α' in the token-infilling process. The data suggests that maintaining a balance between 'c' and 'α' is crucial for achieving high performance. The parameters likely control some aspect of the token-infilling algorithm, and their relative values determine the quality of the generated text as measured by the ROUGE metric.
The strong diagonal trend implies that the algorithm performs best when these parameters are tuned to similar magnitudes. Deviations from this optimal region lead to a significant drop in ROUGE score, indicating a degradation in the quality of the token-infilling. The logarithmic scales suggest that small changes in 'c' and 'α' at lower values have a more significant impact on the ROUGE score than similar changes at higher values. This could be due to the nature of the underlying algorithm or the distribution of the data it is processing. Further investigation into the meaning of 'c' and 'α' within the token-infilling process would be necessary to fully understand the implications of these findings.