## Heatmap: ROUGE Score of Token-Infilling, c vs α
### Overview
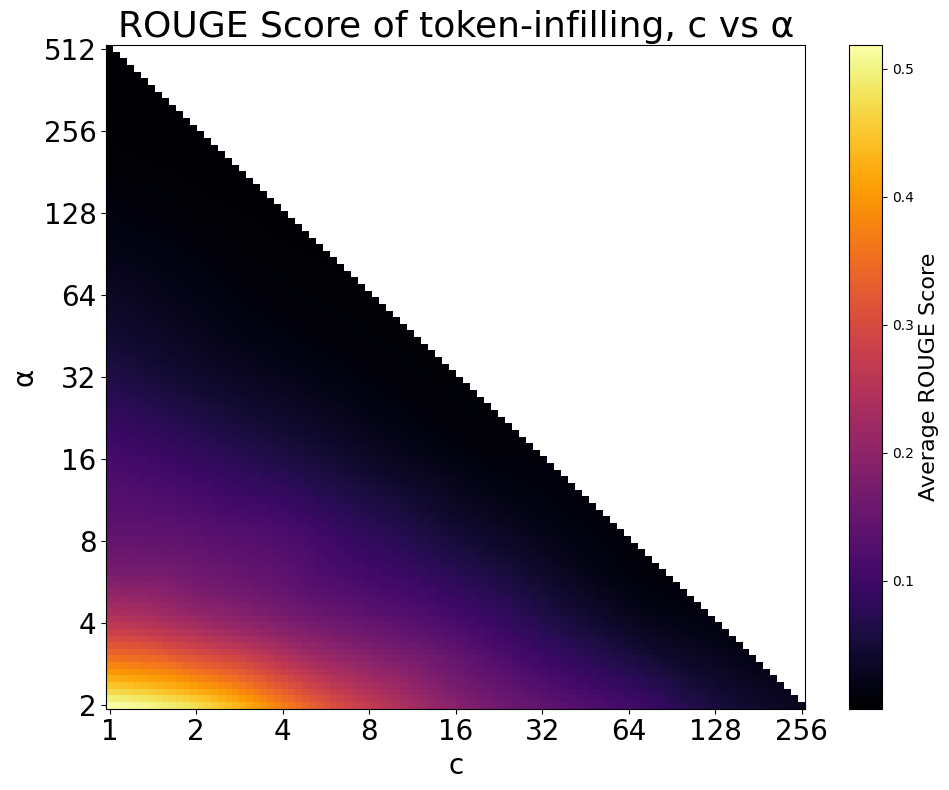
This image is a heatmap visualizing the average ROUGE score for a token-infilling task as a function of two parameters: `c` (x-axis) and `α` (y-axis). The chart demonstrates a clear inverse relationship between the parameters and the resulting score, with performance degrading as either parameter increases. The data is presented on a logarithmic scale for both axes.
### Components/Axes
* **Chart Title:** "ROUGE Score of token-infilling, c vs α" (located at the top center).
* **X-Axis:**
* **Label:** "c" (centered below the axis).
* **Scale:** Logarithmic.
* **Tick Markers (from left to right):** 1, 2, 4, 8, 16, 32, 64, 128, 256.
* **Y-Axis:**
* **Label:** "α" (centered to the left of the axis, rotated 90 degrees).
* **Scale:** Logarithmic.
* **Tick Markers (from bottom to top):** 2, 4, 8, 16, 32, 64, 128, 256, 512.
* **Color Bar (Legend):**
* **Position:** Right side of the chart.
* **Label:** "Average ROUGE Score" (rotated 90 degrees).
* **Scale:** Linear, ranging from 0.0 to 0.5.
* **Color Gradient:** Transitions from black (0.0) through dark purple, magenta, orange, to bright yellow (0.5). Key markers are at 0.0, 0.1, 0.2, 0.3, 0.4, and 0.5.
### Detailed Analysis
The heatmap displays a strong gradient pattern. The highest average ROUGE scores (indicated by bright yellow, ~0.5) are concentrated in the bottom-left corner of the plot, corresponding to the lowest values of both parameters (`c` ≈ 1-2, `α` ≈ 2-4).
As one moves diagonally from the bottom-left to the top-right (increasing both `c` and `α`), the color shifts rapidly through orange, magenta, and purple, indicating a steep decline in the ROUGE score. The majority of the plot area, especially the upper-right region, is black or very dark purple, signifying scores near 0.0.
A distinct, sharp diagonal boundary separates the colored region (non-zero scores) from the solid black region (zero or near-zero scores). This boundary runs approximately from the point (`c`=1, `α`=512) to (`c`=256, `α`=2). This suggests a constraint or threshold where the product or sum of `c` and `α` likely exceeds a limit, causing the infilling task to fail or produce no measurable ROUGE score.
### Key Observations
1. **Optimal Performance Zone:** The system achieves its best performance (ROUGE ~0.5) only when both `c` and `α` are very small.
2. **Rapid Performance Degradation:** The score drops off sharply with even modest increases in either parameter. For example, at `c`=4 and `α`=8, the score is already in the purple range (~0.1-0.2).
3. **Diagonal Constraint Boundary:** The most prominent feature is the sharp diagonal cutoff. No data points with measurable scores exist above this line. This implies a hard operational limit for the token-infilling process.
4. **Parameter Sensitivity:** The system appears highly sensitive to both parameters. The gradient is steep along both axes, but the diagonal nature of the boundary indicates their effects are coupled.
### Interpretation
This heatmap characterizes the operational envelope of a token-infilling model. The ROUGE score, a metric for evaluating automatic summarization/text generation, serves as a proxy for the quality or success of the infilling task.
The data suggests that the model's effectiveness is severely constrained by the parameters `c` and `α`. These parameters likely control aspects like context length, compression rate, or a similar trade-off between input size and output generation. The sharp diagonal boundary is the most critical finding; it defines a clear "feasibility frontier." For any given value of `c`, there is a maximum `α` beyond which the task cannot be completed successfully (score ≈ 0), and vice-versa.
The inverse relationship implies that to maintain a certain level of performance, an increase in one parameter must be compensated by a decrease in the other. The optimal operating point is at the minimal values for both, suggesting the task is easiest with the least constraint or the smallest context/compression ratio. This visualization is essential for understanding the model's limitations and for tuning parameters to stay within the viable, high-performance region of the operational space.