## Heatmap: ROUGE Score of token-infilling, c vs α
### Overview
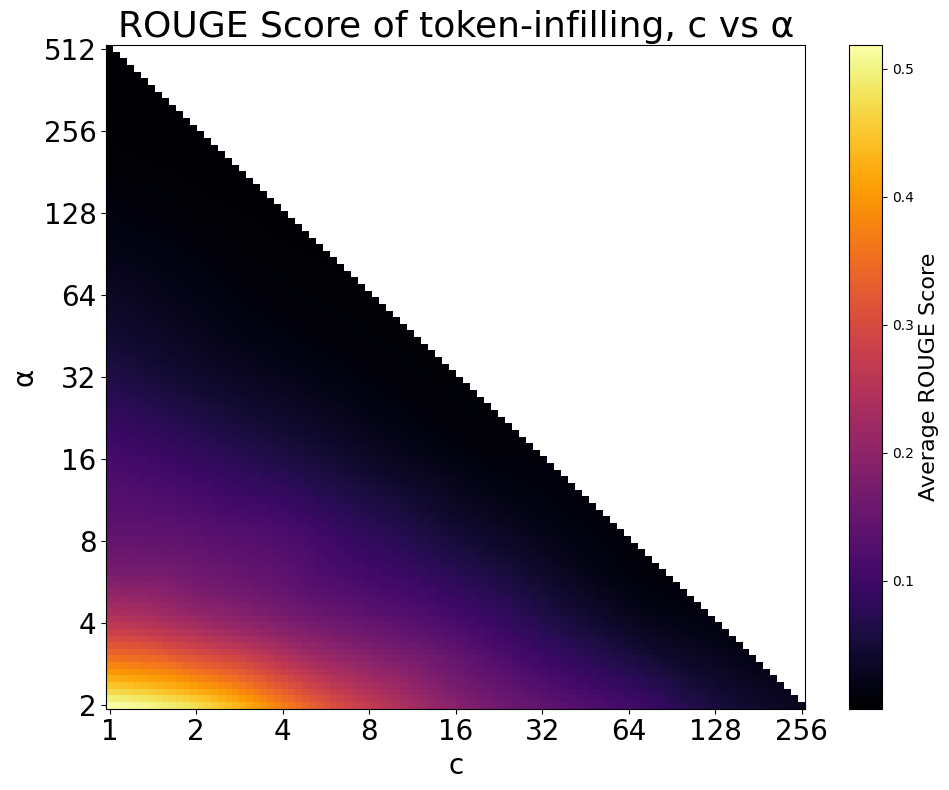
The heatmap displays the ROUGE Score of token-infilling, with the x-axis representing the value of c and the y-axis representing the value of α. The color gradient indicates the average ROUGE Score, with darker shades representing lower scores and lighter shades representing higher scores.
### Components/Axes
- **Title**: ROUGE Score of token-infilling, c vs α
- **X-axis**: c (categorical scale from 1 to 256)
- **Y-axis**: α (categorical scale from 1 to 512)
- **Colorbar**: Average ROUGE Score (scale from 0.1 to 0.5)
### Detailed Analysis or ### Content Details
The heatmap shows a clear trend where the ROUGE Score decreases as the value of c increases. This is evident from the darker shades of purple and black as we move from the bottom left to the top right of the heatmap. The ROUGE Score is highest when c is close to 1 and α is close to 1, and it decreases as c increases and α increases.
### Key Observations
- The heatmap shows a strong negative correlation between c and α.
- The ROUGE Score is highest when c is close to 1 and α is close to 1.
- The ROUGE Score decreases as c increases and α increases.
### Interpretation
The heatmap suggests that the ROUGE Score of token-infilling is highest when c is close to 1 and α is close to 1. As c increases and α increases, the ROUGE Score decreases. This could indicate that the token-infilling technique is more effective when c is low and α is low. However, the exact relationship between c and α and their impact on the ROUGE Score would require further analysis and context.