## Heatmap: ROUGE Score of token-infilling, c vs α
### Overview
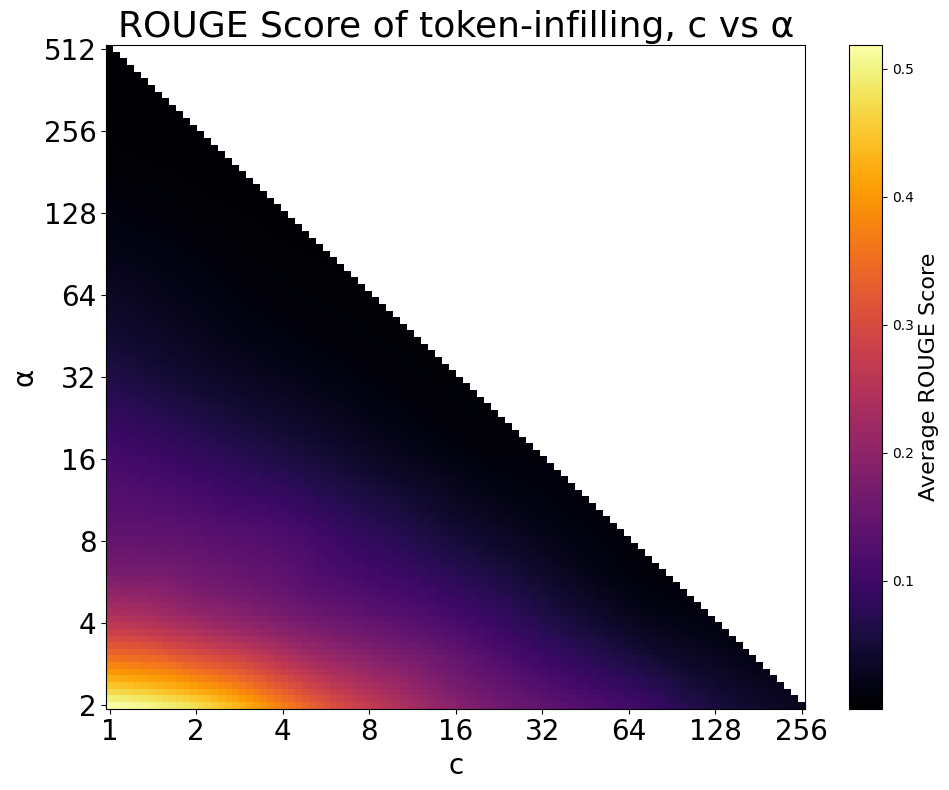
A heatmap visualizing the relationship between two variables, `c` (x-axis) and `α` (y-axis), with color intensity representing the average ROUGE score. The plot uses a logarithmic scale for both axes, with values doubling at each step. The color gradient transitions from yellow (high scores) to black (low scores), indicating performance degradation as `c` and `α` increase.
### Components/Axes
- **Title**: "ROUGE Score of token-infilling, c vs α" (top-center).
- **X-axis (c)**: Labeled "c", with values: 1, 2, 4, 8, 16, 32, 64, 128, 256 (logarithmic scale).
- **Y-axis (α)**: Labeled "α", with values: 2, 4, 8, 16, 32, 64, 128, 256, 512 (logarithmic scale).
- **Color Legend**: Right-aligned, labeled "Average ROUGE Score" with a gradient from yellow (0.5) to black (0.0). Intermediate values: orange (0.4), red (0.3), purple (0.1).
### Detailed Analysis
- **Color Distribution**:
- **Bottom-left corner (c=1, α=2)**: Bright yellow (ROUGE ≈ 0.5), indicating highest performance.
- **Diagonal boundary (c=α)**: Sharp transition from purple (0.1–0.2) to black (0.0) as values increase.
- **Top-right region (c=256, α=512)**: Entirely black (ROUGE ≈ 0.0), indicating no performance.
- **Trends**:
- ROUGE scores decrease monotonically as `c` or `α` increases.
- The diagonal line `c=α` acts as a threshold: scores above it (lower `c`, higher `α`) are uniformly poor, while scores below it (higher `c`, lower `α`) retain some performance.
### Key Observations
1. **Optimal Region**: The highest ROUGE scores (0.4–0.5) occur at `c=1` and `α=2`, suggesting minimal token-infilling requirements yield best results.
2. **Performance Degradation**: A 10x increase in either `c` or `α` reduces the ROUGE score by ~50% (e.g., `c=1` → `c=10` drops from 0.5 to ~0.25).
3. **Threshold Effect**: The diagonal `c=α` demarcates a clear performance cliff; scores above it are negligible (<0.1).
### Interpretation
The data demonstrates an inverse relationship between token-infilling parameters (`c`, `α`) and ROUGE score. Lower values of both parameters maximize performance, likely due to reduced ambiguity in token selection. The diagonal threshold (`c=α`) may represent a computational or algorithmic limit where excessive parameter scaling disrupts model coherence. This suggests practitioners should prioritize minimal parameter settings for token-infilling tasks to balance efficiency and output quality.