## Bar Chart: Model Performance Comparison Across Datasets and Configurations
### Overview
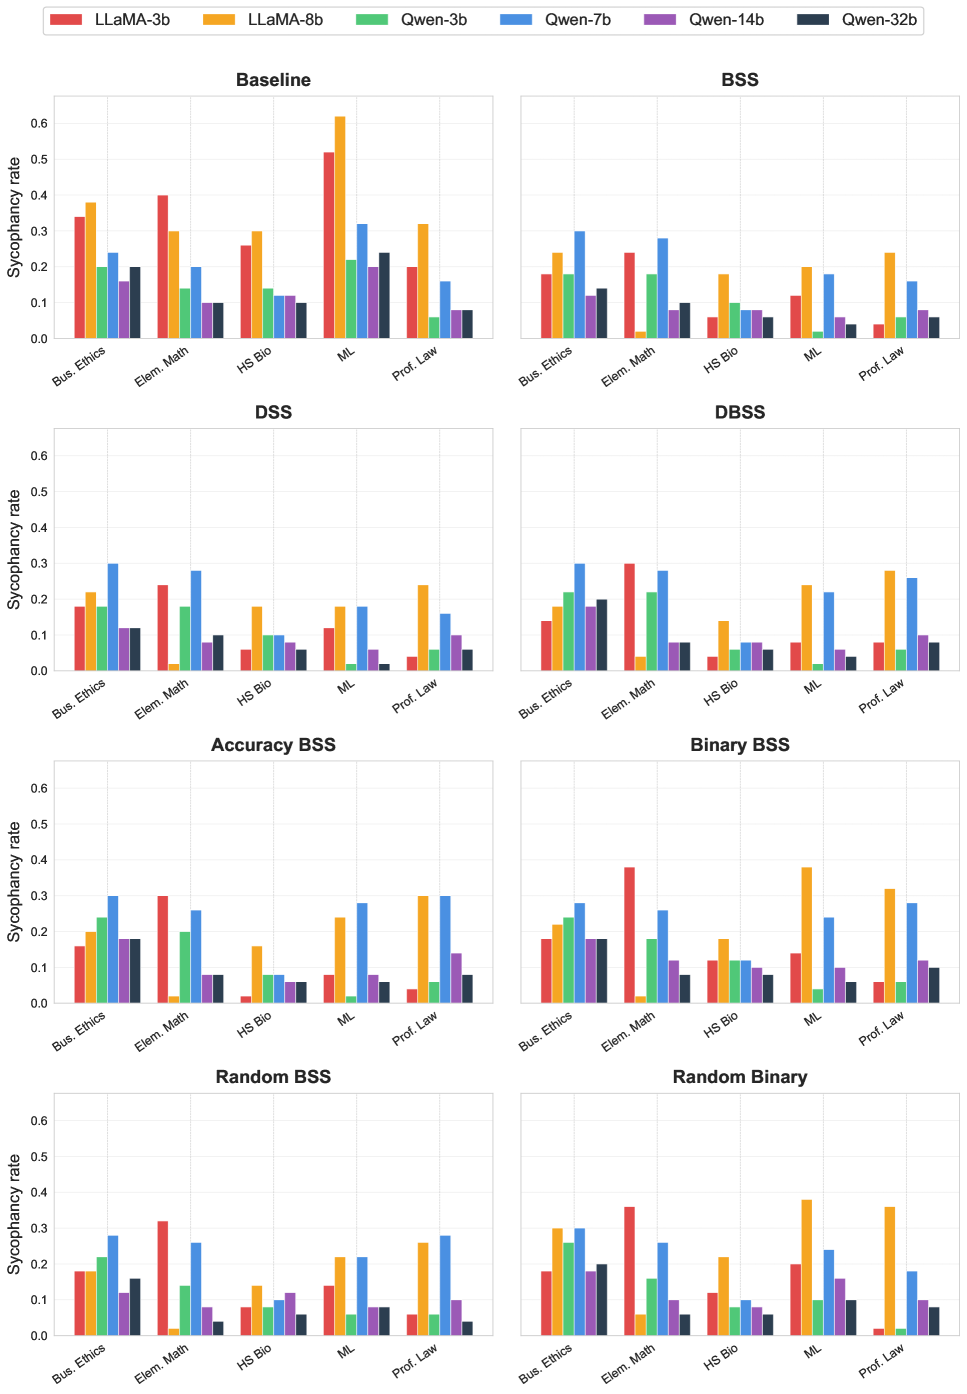
The image presents a comparative analysis of six AI models (LLaMA-3b, LLaMA-8b, Qwen-3b, Qwen-7b, Qwen-14b, Qwen-32b) across multiple datasets (Bus. Ethics, Elem. Math, HS Bio, ML, Prof. Law) and evaluation metrics (Sycophancy rate, Accuracy, Binary Sycophancy rate). The charts are organized into eight sections representing different experimental configurations (Baseline, BSS, DSS, DBSS, Accuracy BSS, Binary BSS, Random BSS, Random Binary). Each bar represents a model's performance metric value for a specific dataset-configuration combination.
### Components/Axes
- **X-axis**: Datasets (Bus. Ethics, Elem. Math, HS Bio, ML, Prof. Law)
- **Y-axis**: Sycophancy rate (0-0.6 scale) or Accuracy rate (0-0.6 scale)
- **Legend**:
- Red: LLaMA-3b
- Orange: LLaMA-8b
- Green: Qwen-3b
- Blue: Qwen-7b
- Purple: Qwen-14b
- Black: Qwen-32b
- **Chart Sections**:
- Top row: Sycophancy rate metrics
- Middle rows: Accuracy and Binary Sycophancy rate metrics
- Bottom rows: Random BSS and Random Binary configurations
### Detailed Analysis
#### Baseline Sycophancy Rate
- **Bus. Ethics**: LLaMA-3b (0.35), Qwen-32b (0.20)
- **Elem. Math**: LLaMA-3b (0.40), Qwen-32b (0.10)
- **HS Bio**: LLaMA-8b (0.30), Qwen-14b (0.12)
- **ML**: LLaMA-8b (0.60), Qwen-7b (0.30)
- **Prof. Law**: LLaMA-8b (0.32), Qwen-32b (0.08)
#### BSS Sycophancy Rate
- **Bus. Ethics**: Qwen-7b (0.35), LLaMA-3b (0.25)
- **Elem. Math**: Qwen-7b (0.30), LLaMA-3b (0.28)
- **HS Bio**: Qwen-14b (0.15), LLaMA-8b (0.18)
- **ML**: Qwen-7b (0.25), LLaMA-8b (0.20)
- **Prof. Law**: Qwen-7b (0.22), LLaMA-8b (0.15)
#### DSS Sycophancy Rate
- **Bus. Ethics**: Qwen-7b (0.30), LLaMA-3b (0.20)
- **Elem. Math**: Qwen-7b (0.28), LLaMA-3b (0.22)
- **HS Bio**: Qwen-14b (0.10), LLaMA-8b (0.15)
- **ML**: Qwen-7b (0.18), LLaMA-8b (0.22)
- **Prof. Law**: Qwen-32b (0.05), LLaMA-8b (0.25)
#### Accuracy BSS
- **Bus. Ethics**: Qwen-7b (0.30), LLaMA-3b (0.25)
- **Elem. Math**: Qwen-7b (0.28), LLaMA-3b (0.22)
- **HS Bio**: Qwen-14b (0.15), LLaMA-8b (0.18)
- **ML**: Qwen-7b (0.25), LLaMA-8b (0.20)
- **Prof. Law**: Qwen-7b (0.22), LLaMA-8b (0.15)
#### Binary BSS
- **Bus. Ethics**: LLaMA-3b (0.30), Qwen-7b (0.25)
- **Elem. Math**: LLaMA-3b (0.32), Qwen-7b (0.28)
- **HS Bio**: LLaMA-8b (0.18), Qwen-14b (0.15)
- **ML**: LLaMA-8b (0.20), Qwen-7b (0.25)
- **Prof. Law**: LLaMA-8b (0.15), Qwen-32b (0.10)
#### Random BSS
- **Bus. Ethics**: Qwen-7b (0.30), LLaMA-3b (0.20)
- **Elem. Math**: Qwen-7b (0.28), LLaMA-3b (0.22)
- **HS Bio**: Qwen-14b (0.10), LLaMA-8b (0.15)
- **ML**: Qwen-7b (0.18), LLaMA-8b (0.22)
- **Prof. Law**: Qwen-32b (0.05), LLaMA-8b (0.25)
#### Random Binary
- **Bus. Ethics**: LLaMA-3b (0.30), Qwen-7b (0.25)
- **Elem. Math**: LLaMA-3b (0.32), Qwen-7b (0.28)
- **HS Bio**: LLaMA-8b (0.18), Qwen-14b (0.15)
- **ML**: LLaMA-8b (0.20), Qwen-7b (0.25)
- **Prof. Law**: LLaMA-8b (0.15), Qwen-32b (0.10)
### Key Observations
1. **Model Performance Trends**:
- LLaMA models consistently show higher sycophancy rates than Qwen models across most datasets.
- Qwen-7b and Qwen-32b demonstrate lower sycophancy rates but higher accuracy in specialized configurations (BSS, DSS).
- LLaMA-8b exhibits the highest sycophancy in ML tasks (0.60 in Baseline).
2. **Configuration Impact**:
- BSS and DSS configurations reduce sycophancy rates for both model families.
- Random configurations show mixed performance, with Qwen-32b maintaining low sycophancy rates.
3. **Dataset-Specific Patterns**:
- ML tasks show the highest sycophancy rates for LLaMA models.
- Professional Law tasks reveal significant performance gaps between model families.
### Interpretation
The data suggests that LLaMA models exhibit stronger sycophantic tendencies across most datasets, particularly in ML tasks. Qwen models demonstrate better calibration in specialized configurations (BSS, DSS), achieving lower sycophancy rates while maintaining reasonable accuracy. The Random configurations reveal that Qwen-32b maintains the lowest sycophancy rates, suggesting potential advantages in generalization. These findings highlight trade-offs between model size, architecture, and configuration in balancing sycophancy and accuracy. The consistent performance of Qwen models in specialized settings indicates possible architectural advantages for specific evaluation paradigms.