## Line Chart: Accuracy vs. Input Size for Different 'r' Values
### Overview
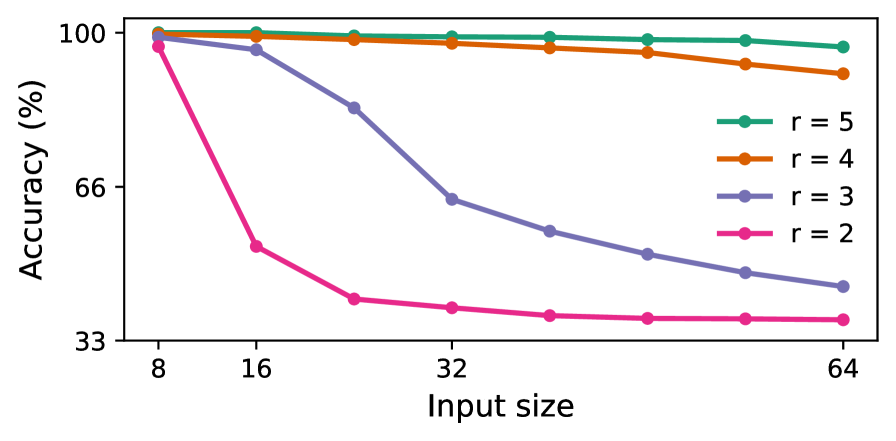
The image is a line chart illustrating the relationship between "Input size" and "Accuracy (%)" for different values of 'r'. There are four lines, each representing a different 'r' value (r=2, r=3, r=4, r=5). The chart shows how accuracy changes as the input size increases for each 'r' value.
### Components/Axes
* **X-axis:** "Input size" with values 8, 16, 32, and 64.
* **Y-axis:** "Accuracy (%)" with values 33, 66, and 100.
* **Legend:** Located on the right side of the chart, it identifies each line by its color and corresponding 'r' value:
* Green: r = 5
* Orange: r = 4
* Purple: r = 3
* Pink: r = 2
### Detailed Analysis
* **Green Line (r = 5):** Starts at approximately 100% accuracy with an input size of 8. It remains relatively stable, decreasing slightly to approximately 97% accuracy at an input size of 64.
* **Orange Line (r = 4):** Starts at approximately 100% accuracy with an input size of 8. It decreases slightly to approximately 90% accuracy at an input size of 64.
* **Purple Line (r = 3):** Starts at approximately 100% accuracy with an input size of 8. It decreases significantly to approximately 40% accuracy at an input size of 64.
* **Pink Line (r = 2):** Starts at approximately 100% accuracy with an input size of 8. It decreases sharply to approximately 45% accuracy at an input size of 16, then continues to decrease, but at a slower rate, reaching approximately 35% accuracy at an input size of 64.
### Key Observations
* As the input size increases, the accuracy tends to decrease for all 'r' values.
* The rate of decrease in accuracy varies depending on the 'r' value. Lower 'r' values (r=2, r=3) experience a more significant drop in accuracy compared to higher 'r' values (r=4, r=5).
* The accuracy for r=5 and r=4 remains relatively high and stable across all input sizes.
* The accuracy for r=2 drops sharply initially and then plateaus.
### Interpretation
The chart suggests that the 'r' value has a significant impact on the accuracy of the model as the input size changes. Higher 'r' values (r=4, r=5) maintain a higher and more stable accuracy, indicating that they are less sensitive to changes in input size. Lower 'r' values (r=2, r=3) are more susceptible to decreases in accuracy as the input size increases, suggesting that they may be less robust or require larger 'r' values for optimal performance with larger inputs. The initial sharp drop in accuracy for r=2 indicates a critical threshold or sensitivity to smaller input sizes.