\n
## Line Chart: Accuracy vs. Input Size for Different 'r' Values
### Overview
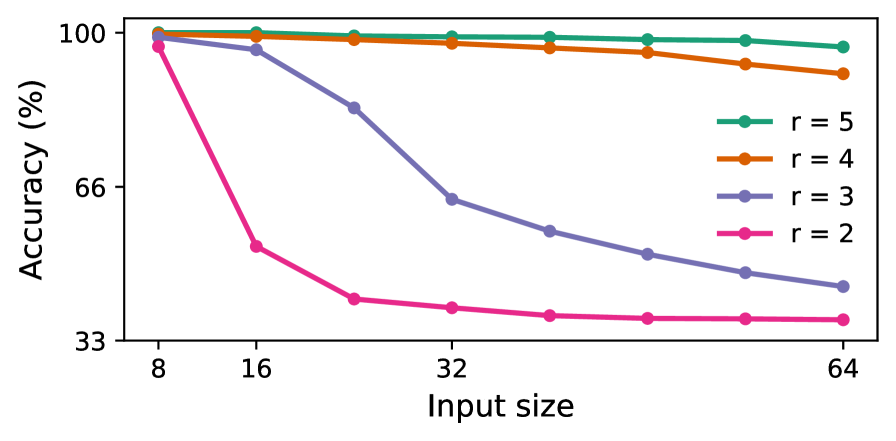
This line chart depicts the relationship between accuracy (in percentage) and input size, for four different values of 'r' (2, 3, 4, and 5). The chart shows how accuracy changes as the input size increases for each 'r' value.
### Components/Axes
* **X-axis:** Input size, ranging from 8 to 64. The axis is labeled "Input size".
* **Y-axis:** Accuracy (in percentage), ranging from 33 to 100. The axis is labeled "Accuracy (%)".
* **Legend:** Located in the top-right corner of the chart. It identifies the four lines by their corresponding 'r' values:
* r = 5 (Green)
* r = 4 (Orange)
* r = 3 (Purple)
* r = 2 (Pink)
### Detailed Analysis
The chart contains four distinct lines, each representing a different 'r' value.
* **r = 5 (Green):** The line starts at approximately 98% accuracy at an input size of 8, remains relatively stable around 96-98% as the input size increases to 64.
* **r = 4 (Orange):** The line begins at approximately 97% accuracy at an input size of 8, and shows a slight decrease to around 94% at an input size of 64.
* **r = 3 (Purple):** The line starts at approximately 96% accuracy at an input size of 8, and decreases to approximately 85% accuracy at an input size of 64.
* **r = 2 (Pink):** This line exhibits the most significant decrease in accuracy. It starts at approximately 96% accuracy at an input size of 8, and drops dramatically to approximately 40% accuracy at an input size of 64.
Here's a more detailed breakdown of approximate data points:
| Input Size | r = 5 (Green) | r = 4 (Orange) | r = 3 (Purple) | r = 2 (Pink) |
|---|---|---|---|---|
| 8 | 98% | 97% | 96% | 96% |
| 16 | 98% | 96% | 92% | 85% |
| 32 | 97% | 95% | 78% | 55% |
| 64 | 96% | 94% | 68% | 40% |
### Key Observations
* Accuracy generally decreases as input size increases, but the rate of decrease varies significantly depending on the value of 'r'.
* The line for r = 2 shows a much steeper decline in accuracy compared to the other lines.
* The lines for r = 5 and r = 4 maintain relatively high accuracy levels even as the input size increases.
* The lines for r = 3 and r = 2 show a more pronounced decrease in accuracy with increasing input size.
### Interpretation
The data suggests that the value of 'r' plays a crucial role in maintaining accuracy as the input size increases. Higher values of 'r' (5 and 4) appear to be more robust to increases in input size, while lower values (3 and particularly 2) suffer a significant loss of accuracy. This could indicate that a larger 'r' value allows the model to better generalize from the input data, or that it is less susceptible to overfitting. The steep decline in accuracy for r = 2 suggests that this value may be too low to effectively process larger input sizes. The chart demonstrates a trade-off between input size and accuracy, and highlights the importance of selecting an appropriate 'r' value for a given application. The 'r' parameter likely represents a hyperparameter of a model, and the chart is evaluating the model's performance under different hyperparameter settings.