## 3D Scatter Plot: Object Detection Setup
### Overview
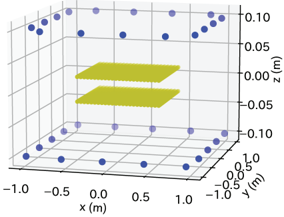
The image is a 3D scatter plot depicting a setup for object detection. It shows two rectangular objects positioned in space, surrounded by a grid of blue points. The plot visualizes the spatial arrangement of the objects and the points, likely representing sensors or detection locations.
### Components/Axes
* **X-axis:** Labeled "x (m)", ranging from -1.0 to 1.0 in increments of 0.5.
* **Y-axis:** Labeled "y (m)", ranging from -1.0 to 1.0 in increments of 0.5.
* **Z-axis:** Labeled "z (m)", ranging from -0.10 to 0.10 in increments of 0.05.
* **Objects:** Two yellow rectangular objects are positioned at different z-axis values.
* **Points:** Blue points are arranged in a grid-like pattern around the objects.
### Detailed Analysis
* **Object 1 (Top):** Appears to be centered around x=0, y=0, and z=0.025 (estimated).
* **Object 2 (Bottom):** Appears to be centered around x=0, y=0, and z=-0.025 (estimated).
* **Blue Points:** The blue points are arranged in a rectangular grid on the x-y plane at z=-0.1 and z=0.1. There are also points along the x-z and y-z planes.
### Key Observations
* The two yellow objects are parallel to each other and to the x-y plane.
* The blue points form a spatial grid, potentially representing sensor locations or points of interest for object detection.
* The objects are centered within the grid of points.
### Interpretation
The image likely represents a setup for object detection, where the yellow objects are the targets to be detected, and the blue points represent sensors or detection locations. The spatial arrangement of the objects and points is crucial for the performance of the object detection system. The plot provides a visual representation of this arrangement, allowing for analysis and optimization of the system. The grid of points suggests a systematic approach to sensing the environment around the objects.