\n
## 3D Scatter Plot: Spatial Distribution of Points
### Overview
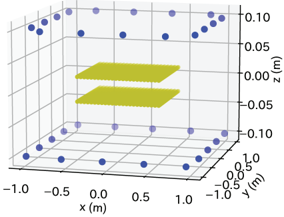
The image depicts a 3D scatter plot showing the distribution of points in a cubic space. Two horizontal planes are visible, and the points appear to be scattered around these planes. The plot visualizes data points in a three-dimensional coordinate system defined by x, y, and z axes.
### Components/Axes
* **X-axis:** Labeled "x (m)", ranging from approximately -1.0 to 1.0 meters.
* **Y-axis:** Labeled "y (m)", ranging from approximately -1.0 to 1.0 meters.
* **Z-axis:** Labeled "z (m)", ranging from approximately -0.10 to 0.10 meters.
* **Planes:** Two yellow planes are positioned horizontally within the cubic space. The top plane is at approximately z = 0.05 m, and the bottom plane is at approximately z = -0.05 m.
* **Points:** Approximately 20 blue spherical points are scattered throughout the space.
### Detailed Analysis
The points are distributed in two clusters, one above and one below the yellow planes.
**Upper Cluster:**
The points in the upper cluster are centered around z = 0.05 m. Their x and y coordinates range from approximately -1.0 to 1.0 m. The points are not perfectly aligned, showing some scatter.
Approximate coordinates (x, y, z):
* (-0.8, -0.8, 0.08)
* (-0.8, 0.8, 0.07)
* (0.8, -0.8, 0.09)
* (0.8, 0.8, 0.06)
* (0.0, 0.0, 0.07)
* (-0.5, 0.5, 0.08)
* (0.5, -0.5, 0.06)
* (0.5, 0.5, 0.09)
**Lower Cluster:**
The points in the lower cluster are centered around z = -0.05 m. Their x and y coordinates also range from approximately -1.0 to 1.0 m. Similar to the upper cluster, there is some scatter in the points.
Approximate coordinates (x, y, z):
* (-0.8, -0.8, -0.07)
* (-0.8, 0.8, -0.06)
* (0.8, -0.8, -0.08)
* (0.8, 0.8, -0.05)
* (0.0, 0.0, -0.06)
* (-0.5, 0.5, -0.07)
* (0.5, -0.5, -0.05)
* (0.5, 0.5, -0.08)
### Key Observations
* The points are not randomly distributed; they are concentrated around the two horizontal planes.
* There is a clear separation between the upper and lower clusters based on the z-coordinate.
* The distribution of points within each cluster appears relatively uniform in the x and y directions.
### Interpretation
The data suggests a spatial arrangement where points are preferentially located near two distinct planes. This could represent a physical system with two layers or surfaces where particles or events are concentrated. The uniform distribution within each layer suggests that the points are not influenced by any specific patterns or gradients within those layers. The two planes could represent boundaries or interfaces within a larger system. The consistent spacing between the planes (approximately 0.1 m) might indicate a regular structure or periodicity. Without additional context, it's difficult to determine the exact nature of the system being represented, but the visualization clearly demonstrates a non-random, layered distribution of points.