## 3D Coordinate System Diagram: Sensor Network and Data Collection Zones
### Overview
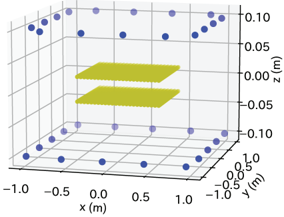
The image depicts a 3D coordinate system with labeled axes (x, y, z) and two distinct elements: blue circular markers (sensor nodes) and yellow planar regions (data collection zones). The spatial arrangement suggests a technical setup for environmental monitoring or spatial data analysis.
### Components/Axes
- **Axes**:
- **x-axis**: Labeled "x (m)" with range -1.0 to 1.0 meters.
- **y-axis**: Labeled "y (m)" with range -1.0 to 1.0 meters.
- **z-axis**: Labeled "z (m)" with range -0.10 to 0.10 meters.
- **Legend**:
- **Blue dots**: Labeled "Sensor Nodes" (positioned at grid intersections and perimeter).
- **Yellow planes**: Labeled "Data Collection Zones" (two horizontal layers).
### Detailed Analysis
- **Sensor Nodes (Blue Dots)**:
- Distributed across the grid with approximate coordinates:
- Perimeter: (-1.0, -1.0, -0.10), (1.0, -1.0, -0.10), (-1.0, 1.0, -0.10), (1.0, 1.0, -0.10).
- Interior: (-0.5, 0.0, 0.05), (0.5, 0.0, 0.05), (0.0, -0.5, -0.05), (0.0, 0.5, -0.05).
- Uniform spacing suggests a structured grid pattern.
- **Data Collection Zones (Yellow Planes)**:
- **Top plane**: Positioned at z ≈ 0.00 meters, spanning x: -0.5 to 0.5 and y: -0.5 to 0.5.
- **Bottom plane**: Positioned at z ≈ -0.05 meters, spanning the same x and y range as the top plane.
- Both planes are parallel to the xy-plane and offset vertically.
### Key Observations
1. **Spatial Distribution**: Sensor nodes are concentrated at grid intersections and perimeter edges, with fewer nodes in the interior.
2. **Layered Zones**: The two yellow planes are separated by 0.05 meters vertically, indicating distinct data collection layers.
3. **Symmetry**: The setup exhibits symmetry about the z-axis, with mirrored sensor node placements.
### Interpretation
The diagram likely represents a **sensor network architecture** for monitoring environmental parameters (e.g., temperature, humidity) across a defined spatial grid. The **blue dots** (sensor nodes) are strategically placed to cover the perimeter and interior, ensuring comprehensive data coverage. The **yellow planes** (data collection zones) may represent regions of interest where data aggregation or analysis occurs, possibly simulating layered environmental strata (e.g., surface vs. subsurface measurements). The absence of dynamic trends (e.g., time-dependent data) suggests this is a static schematic for system design rather than real-time data visualization. The symmetry and grid alignment imply a focus on precision and uniformity in data collection.