## Diagram: Cell Averaging
### Overview
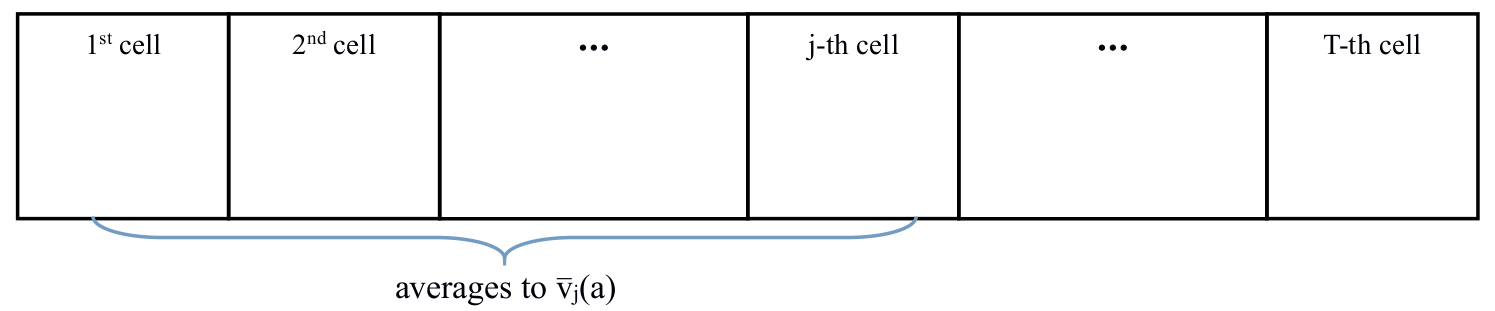
The image is a diagram illustrating the concept of cell averaging. It shows a series of adjacent rectangular cells, labeled from the 1st cell to the T-th cell, with an annotation indicating that the averages are related to v̄j(a).
### Components/Axes
* **Cells:** A series of rectangular cells arranged horizontally.
* The cells are labeled as: 1st cell, 2nd cell, j-th cell, and T-th cell. There are ellipsis (...) between the 2nd and j-th cell, and between the j-th and T-th cell, indicating that there are more cells in the sequence.
* **Annotation:** A light blue brace spans from the 1st cell to the j-th cell. Below the brace, the text "averages to v̄j(a)" is present.
### Detailed Analysis
* The diagram depicts a sequence of cells, suggesting a spatial or temporal discretization.
* The annotation "averages to v̄j(a)" implies that the values within the first to j-th cells are being averaged to produce a value denoted as v̄j(a).
* The use of "j-th" and "T-th" cells indicates that 'j' and 'T' are indices representing specific cells within the sequence.
### Key Observations
* The diagram focuses on the averaging process applied to a subset of cells (1st to j-th).
* The variable 'a' within v̄j(a) is not explicitly defined in the diagram, but it likely represents a parameter or variable being averaged.
### Interpretation
The diagram illustrates a fundamental concept of averaging values across a range of cells. This could represent spatial averaging in a grid, temporal averaging over a time series, or any other scenario where data is discretized into cells and then averaged. The notation v̄j(a) suggests that the average is calculated up to the j-th cell, and the result depends on some variable 'a'. The diagram is likely part of a larger explanation of a numerical method or data processing technique.