# Technical Document Extraction: Array/Sequence Diagram
## 1. Image Overview
The image is a technical diagram representing a sequential data structure or a series of time steps, likely used in the context of signal processing, statistics, or machine learning. It illustrates a process of averaging values across a subset of a sequence.
## 2. Component Isolation
### Region A: Main Sequence (Top)
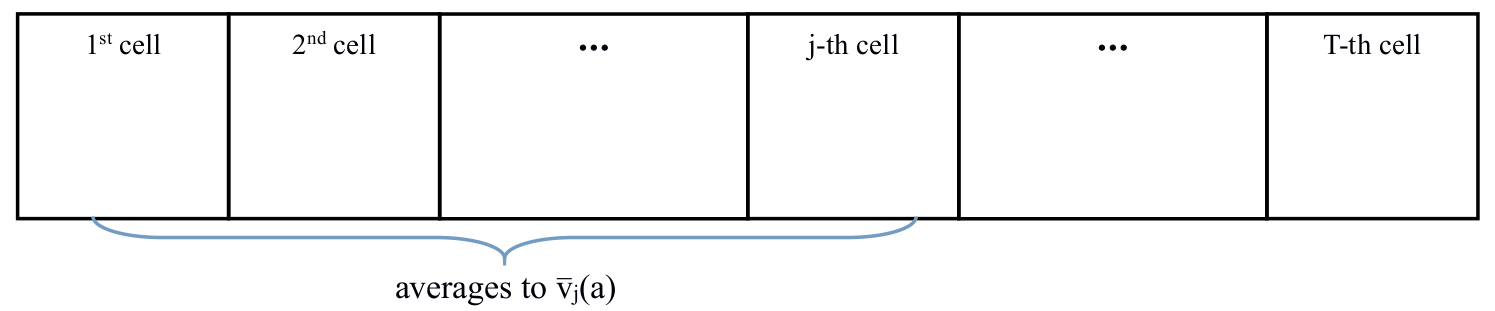
The primary visual element is a horizontal rectangular bar divided into six distinct segments (cells). Each cell contains a text label at the top center.
| Cell Position (Left to Right) | Text Label | Description |
| :--- | :--- | :--- |
| 1 | $1^{\text{st}}$ cell | The initial element of the sequence. |
| 2 | $2^{\text{nd}}$ cell | The second element of the sequence. |
| 3 | $\dots$ | Ellipsis indicating omitted intermediate cells. |
| 4 | j-th cell | An arbitrary $j$-th element in the sequence. |
| 5 | $\dots$ | Ellipsis indicating further omitted intermediate cells. |
| 6 | T-th cell | The final element of the sequence, where $T$ represents the total length. |
### Region B: Annotation (Bottom)
Below the main sequence, there is a grouping indicator and a mathematical label.
* **Bracket:** A light blue curly brace (bracket) spans horizontally beneath the first four cells (from the "$1^{\text{st}}$ cell" to the "j-th cell").
* **Label:** Centered beneath the bracket is the text: **"averages to $\bar{v}_j(a)$"**.
## 3. Technical Interpretation and Logic
* **Sequence Structure:** The diagram represents a discrete sequence of length $T$.
* **Spatial Grounding:** The bracket is anchored at the left edge of the first cell and extends to the right edge of the $j$-th cell.
* **Mathematical Operation:** The diagram indicates that the values contained within the first $j$ cells are being aggregated. Specifically, the label "averages to $\bar{v}_j(a)$" suggests that the mean of the elements from index $1$ to $j$ is calculated, and the resulting value is denoted by the variable $\bar{v}_j(a)$.
* **Variable Notation:**
* $\bar{v}$ typically denotes an average or mean value.
* The subscript $j$ indicates the cumulative nature of the average (up to the $j$-th element).
* The $(a)$ likely refers to a specific parameter, action, or state associated with the data.
## 4. Summary of Data Points
* **Total Elements:** $T$
* **Index of Interest:** $j$
* **Range of Operation:** $[1, j]$
* **Resultant Value:** $\bar{v}_j(a)$