\n
## Diagram: Cell Arrangement with Averaging Indication
### Overview
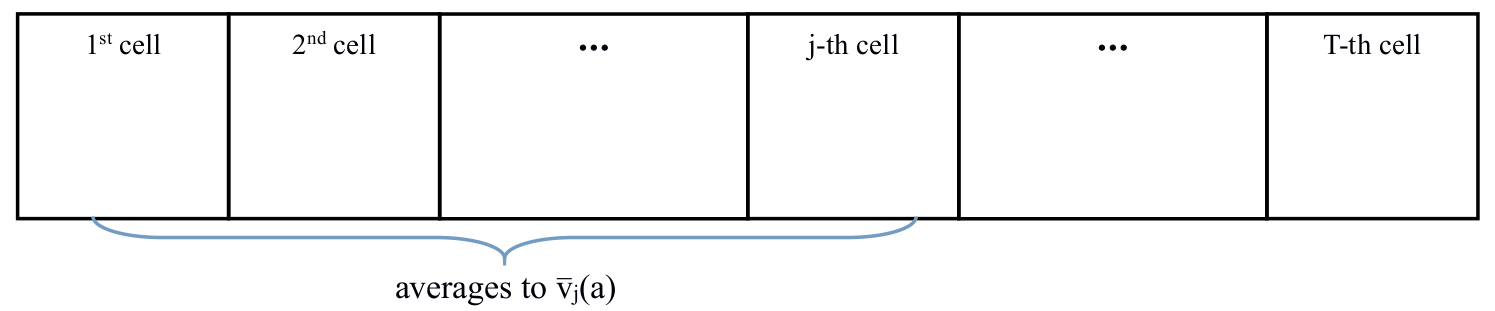
The image depicts a linear arrangement of cells, labeled sequentially from "1st cell" to "T-th cell", with an indication of averaging occurring across these cells. The diagram appears to illustrate a concept related to data aggregation or smoothing.
### Components/Axes
The diagram consists of:
* **Cells:** Rectangular boxes representing individual cells.
* **Labels:** Text labels indicating the position of each cell (e.g., "1st cell", "2nd cell", "j-th cell", "T-th cell").
* **Ellipsis:** "..." indicating that there are cells between those explicitly labeled.
* **Averaging Indicator:** A curved arrow pointing upwards, with the text "averages to v̄(a)" associated with it.
### Detailed Analysis or Content Details
The diagram shows a sequence of cells. The first few cells are explicitly labeled as "1st cell", "2nd cell", and then "j-th cell". The sequence continues with an ellipsis ("...") to indicate omitted cells, and ends with "T-th cell". The "T" in "T-th cell" likely represents a total number of cells.
Below the cells, a curved arrow points upwards, labeled "averages to v̄(a)". This indicates that the values within the cells are being averaged, and the result of this averaging is represented by "v̄(a)". The "v̄" likely denotes an average value, and "(a)" could be a parameter or index.
### Key Observations
The diagram highlights the concept of averaging values across a series of cells. The use of "T-th cell" suggests a defined total number of cells in the sequence. The averaging process is indicated as resulting in a value "v̄(a)".
### Interpretation
The diagram likely represents a process where data is collected in a series of cells and then aggregated by calculating the average. This could be a simplified representation of a time series analysis, a spatial averaging process, or a similar data processing technique. The notation "v̄(a)" suggests that the average is not simply a global average, but may be dependent on some parameter "a". The diagram is conceptual and does not provide specific data values, but rather illustrates the relationship between individual cell values and their average. It is a visual aid to explain a mathematical or statistical concept.