# Technical Document Extraction: Oscillatory Behavior Analysis
## Image Overview
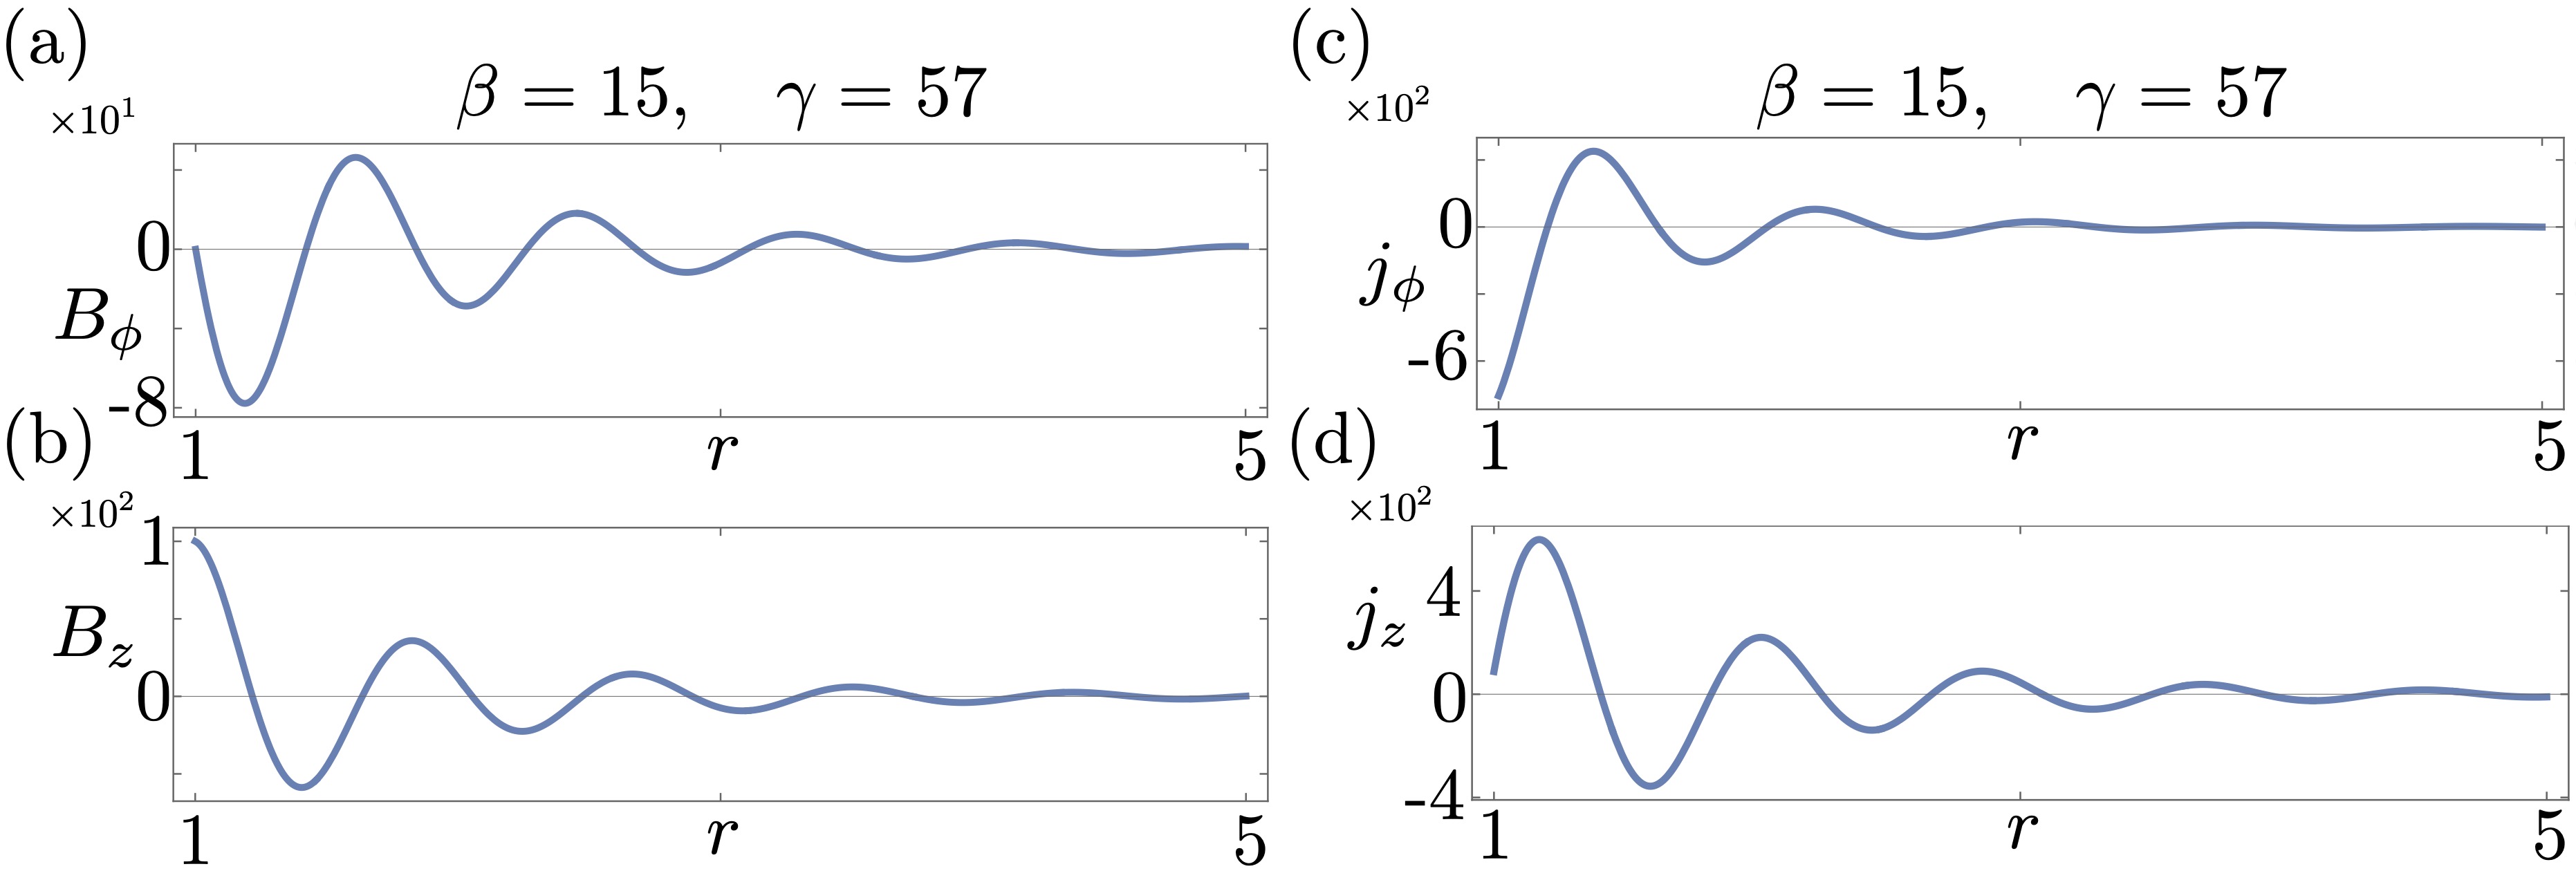
The image contains four subplots (a)-(d) depicting oscillatory behavior of physical quantities as functions of radial distance \( r \). All subplots share identical parameters: \( \beta = 15 \), \( \gamma = 57 \). Each plot uses a logarithmic y-axis scale, with distinct variables and amplitude ranges.
---
### Subplot (a): \( B_\phi \) Oscillation
**Title**: \( B_\phi \) Oscillation (\( \beta = 15, \gamma = 57 \))
**Axes**:
- \( x \)-axis: \( r \) (radial distance), range [1, 5]
- \( y \)-axis: \( B_\phi \times 10^1 \), range [-8, 0]
**Key Observations**:
1. **Trend**: Oscillatory waveform with decreasing amplitude over \( r \).
2. **Data Points**:
- \( r = 1 \): \( B_\phi = 0 \times 10^1 \)
- \( r = 2 \): \( B_\phi \approx -8 \times 10^1 \) (minimum)
- \( r = 3 \): \( B_\phi \approx 0 \times 10^1 \) (zero-crossing)
- \( r = 4 \): \( B_\phi \approx 8 \times 10^1 \) (peak)
- \( r = 5 \): \( B_\phi \approx 0 \times 10^1 \) (zero-crossing)
**Legend**: None present.
---
### Subplot (b): \( B_z \) Oscillation
**Title**: \( B_z \) Oscillation (\( \beta = 15, \gamma = 57 \))
**Axes**:
- \( x \)-axis: \( r \), range [1, 5]
- \( y \)-axis: \( B_z \times 10^1 \), range [-6, 1]
**Key Observations**:
1. **Trend**: Damped oscillations with amplitude reduction.
2. **Data Points**:
- \( r = 1 \): \( B_z = 1 \times 10^1 \) (peak)
- \( r = 2 \): \( B_z \approx -6 \times 10^1 \) (minimum)
- \( r = 3 \): \( B_z \approx 0 \times 10^1 \) (zero-crossing)
- \( r = 4 \): \( B_z \approx 6 \times 10^1 \) (peak)
- \( r = 5 \): \( B_z \approx 0 \times 10^1 \) (zero-crossing)
**Legend**: None present.
---
### Subplot (c): \( j_\phi \) Oscillation
**Title**: \( j_\phi \) Oscillation (\( \beta = 15, \gamma = 57 \))
**Axes**:
- \( x \)-axis: \( r \), range [1, 5]
- \( y \)-axis: \( j_\phi \times 10^2 \), range [-6, 0]
**Key Observations**:
1. **Trend**: Sustained oscillations with minimal damping.
2. **Data Points**:
- \( r = 1 \): \( j_\phi = 0 \times 10^2 \)
- \( r = 2 \): \( j_\phi \approx -6 \times 10^2 \) (minimum)
- \( r = 3 \): \( j_\phi \approx 0 \times 10^2 \) (zero-crossing)
- \( r = 4 \): \( j_\phi \approx 6 \times 10^2 \) (peak)
- \( r = 5 \): \( j_\phi \approx 0 \times 10^2 \) (zero-crossing)
**Legend**: None present.
---
### Subplot (d): \( j_z \) Oscillation
**Title**: \( j_z \) Oscillation (\( \beta = 15, \gamma = 57 \))
**Axes**:
- \( x \)-axis: \( r \), range [1, 5]
- \( y \)-axis: \( j_z \times 10^2 \), range [-4, 4]
**Key Observations**:
1. **Trend**: Persistent oscillations with consistent amplitude.
2. **Data Points**:
- \( r = 1 \): \( j_z = 4 \times 10^2 \) (peak)
- \( r = 2 \): \( j_z \approx -4 \times 10^2 \) (minimum)
- \( r = 3 \): \( j_z \approx 0 \times 10^2 \) (zero-crossing)
- \( r = 4 \): \( j_z \approx 4 \times 10^2 \) (peak)
- \( r = 5 \): \( j_z \approx 0 \times 10^2 \) (zero-crossing)
**Legend**: None present.
---
### Cross-Subplot Analysis
- **Parameter Consistency**: All subplots share \( \beta = 15 \), \( \gamma = 57 \), suggesting these parameters govern the oscillatory dynamics.
- **Amplitude Scaling**:
- \( B_\phi \) and \( B_z \): \( \times 10^1 \) scale (subplots a, b).
- \( j_\phi \) and \( j_z \): \( \times 10^2 \) scale (subplots c, d).
- **Waveform Similarity**: All subplots exhibit sinusoidal-like oscillations with phase shifts.
---
### Missing Elements
- **Legend**: No legend is present to correlate line colors (blue) with data series.
- **Units**: Explicit units for \( B_\phi, B_z, j_\phi, j_z \) are not provided (e.g., Tesla, Amperes).
---
### Conclusion
The subplots collectively illustrate oscillatory behavior of magnetic (\( B_\phi, B_z \)) and current density (\( j_\phi, j_z \)) components as functions of radial distance \( r \). Damping effects are evident in \( B_\phi \) and \( B_z \), while \( j_\phi \) and \( j_z \) maintain sustained oscillations. Further analysis requires unit specifications and legend clarification.