# Technical Document Extraction: Control Value Over Time
## Chart Title
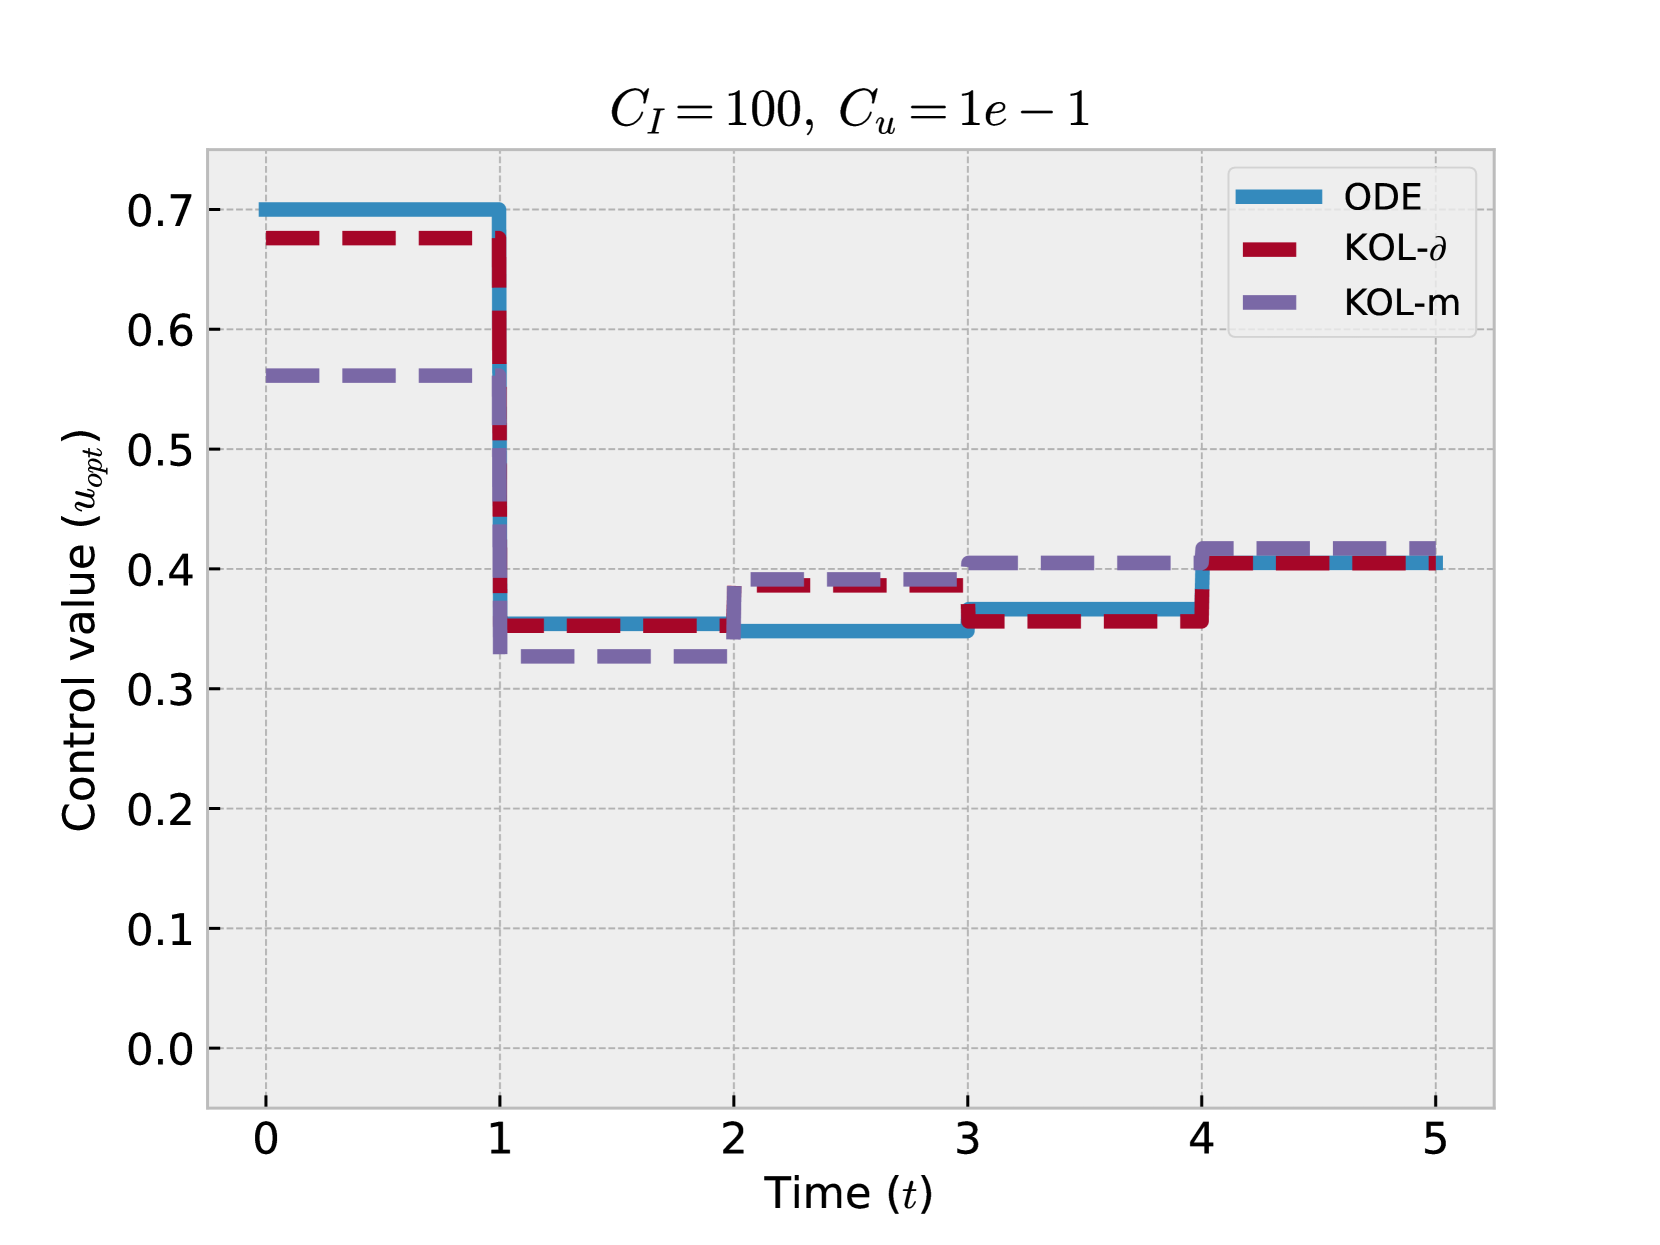
- **Title**: Control Value Over Time
- **Parameters**:
- \( C_I = 100 \)
- \( C_u = 1e-1 \)
## Axes
- **X-axis (Time, \( t \))**:
- Range: \( 0 \leq t \leq 5 \)
- Labels: Incremented by 1 (0, 1, 2, 3, 4, 5)
- **Y-axis (Control Value, \( u_{opt} \))**:
- Range: \( 0.0 \leq u_{opt} \leq 0.7 \)
- Labels: Incremented by 0.1 (0.0, 0.1, ..., 0.7)
## Legend
- **Color-Coded Strategies**:
- **Blue**: ODE
- **Red (dashed)**: KOL-δ
- **Purple (dotted)**: KOL-m
## Line Descriptions
1. **ODE (Blue Solid Line)**:
- **Initial Value**: \( u_{opt} = 0.7 \) at \( t = 0 \).
- **Transition**: Drops sharply to \( u_{opt} = 0.35 \) at \( t = 1 \).
- **Stability**: Remains constant at \( u_{opt} = 0.35 \) for \( t \geq 1 \).
2. **KOL-δ (Red Dashed Line)**:
- **Initial Value**: \( u_{opt} = 0.6 \) at \( t = 0 \).
- **Transition**: Drops sharply to \( u_{opt} = 0.35 \) at \( t = 1 \).
- **Fluctuation**: Oscillates between \( u_{opt} = 0.35 \) and \( u_{opt} = 0.4 \) for \( t \geq 1 \).
3. **KOL-m (Purple Dotted Line)**:
- **Initial Value**: \( u_{opt} = 0.55 \) at \( t = 0 \).
- **Transition**: Drops sharply to \( u_{opt} = 0.35 \) at \( t = 1 \).
- **Fluctuation**: Oscillates between \( u_{opt} = 0.35 \) and \( u_{opt} = 0.45 \) for \( t \geq 1 \).
## Key Observations
- All strategies exhibit a sharp drop in control value at \( t = 1 \).
- ODE stabilizes at the lowest control value (\( 0.35 \)) post-transition.
- KOL-δ and KOL-m show sustained oscillations around their post-transition values.
- KOL-m achieves the highest post-transition control value (\( 0.45 \)) compared to KOL-δ (\( 0.4 \)).
## Data Points Summary
| Time (\( t \)) | ODE (\( u_{opt} \)) | KOL-δ (\( u_{opt} \)) | KOL-m (\( u_{opt} \)) |
|----------------|---------------------|-----------------------|-----------------------|
| 0 | 0.7 | 0.6 | 0.55 |
| 1 | 0.35 | 0.35 | 0.35 |
| 2 | 0.35 | 0.35 | 0.4 |
| 3 | 0.35 | 0.35 | 0.4 |
| 4 | 0.35 | 0.35 | 0.45 |
| 5 | 0.35 | 0.35 | 0.45 |
## Notes
- **ODE** demonstrates the most stable post-transition behavior.
- **KOL-m** exhibits the highest variability but also the highest peak control value.
- **KOL-δ** balances stability and moderate control value.