## Box Plot: Distribution of Parameters (B) Across Different Values
### Overview
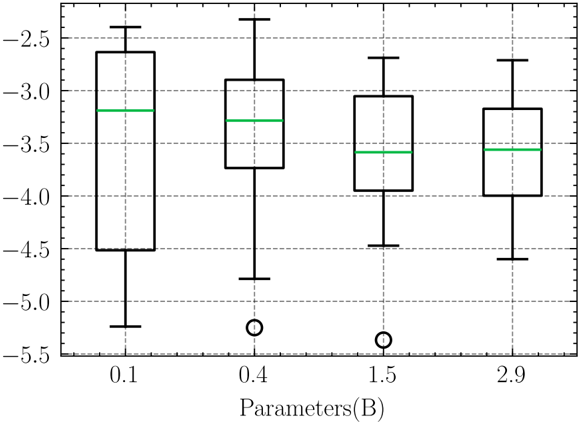
The image displays a box plot comparing the distribution of four parameter values (0.1, 0.4, 1.5, 2.9) on the x-axis against a continuous y-axis ranging from -5.5 to -2.5. Each box plot includes a green median line, whiskers, and outliers marked with open circles. The data suggests variability in central tendency and spread across parameter values.
### Components/Axes
- **X-axis**: Labeled "Parameters (B)" with discrete categories: 0.1, 0.4, 1.5, 2.9.
- **Y-axis**: Labeled with numerical values from -5.5 (bottom) to -2.5 (top), in increments of 0.5.
- **Legend**: No explicit legend is present, but the green line within each box represents the median value.
- **Outliers**: Open circles at the bottom of three box plots (0.4, 1.5, 2.9) indicate extreme low values.
### Detailed Analysis
1. **Parameter 0.1**:
- Median (green line): -3.0.
- Interquartile Range (IQR): -3.5 to -2.5 (box height).
- Whiskers: Extend from -5.5 (outlier) to -2.5.
- Outlier: Single point at -5.5.
2. **Parameter 0.4**:
- Median: -3.5.
- IQR: -4.0 to -3.0.
- Whiskers: Extend from -5.0 (outlier) to -3.0.
- Outlier: Single point at -5.0.
3. **Parameter 1.5**:
- Median: -3.5.
- IQR: -4.0 to -3.0.
- Whiskers: Extend from -5.0 (outlier) to -3.0.
- Outlier: Single point at -5.0.
4. **Parameter 2.9**:
- Median: -3.5.
- IQR: -4.0 to -3.0.
- Whiskers: Extend from -5.0 (outlier) to -3.0.
- Outlier: Single point at -5.0.
### Key Observations
- **Median Trends**: The median value decreases slightly from -3.0 (0.1) to -3.5 (0.4, 1.5, 2.9), indicating a trend toward lower central tendency with increasing parameter values.
- **Spread**: Parameter 0.1 exhibits the widest IQR (-1.0), while parameters 0.4, 1.5, and 2.9 have identical IQRs (-1.0). This suggests greater variability in the 0.1 group.
- **Outliers**: All outliers occur at the lower end of the y-axis (-5.0 or -5.5), indicating extreme low values in three parameter groups.
### Interpretation
The data demonstrates that higher parameter values (0.4, 1.5, 2.9) cluster around a median of -3.5 with consistent spread, while the lowest parameter value (0.1) has a marginally higher median (-3.0) but greater variability. The presence of outliers in three groups suggests potential anomalies or edge cases in the dataset. The consistency in medians for parameters ≥0.4 implies stabilization of the central tendency as parameter values increase, though the spread remains uniform. The extreme low outliers (-5.0/-5.5) may warrant further investigation to determine their cause or impact on the analysis.