## Scatter Plot: Training Loss vs. Parameters & Tokens vs. FLOPs
### Overview
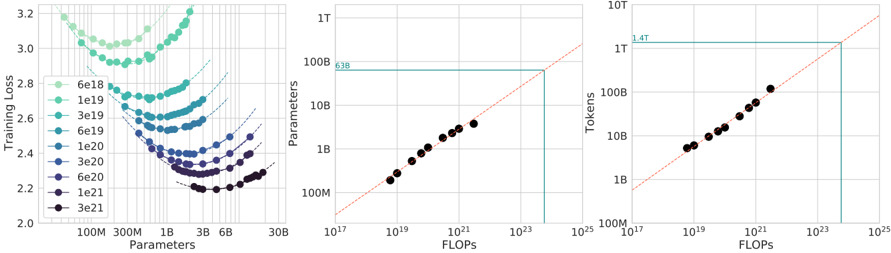
The image presents two scatter plots. The left plot shows Training Loss as a function of Parameters, with different curves representing different training step counts. The right plot shows Tokens processed as a function of FLOPs (Floating Point Operations). A horizontal line is present in the left plot, and a diagonal line is present in the right plot.
### Components/Axes
**Left Plot:**
* **X-axis:** Parameters (log scale, from 10B to 6B). Markers are at approximately 100M, 300M, 1B, 3B, 6B.
* **Y-axis:** Training Loss (linear scale, from 2.0 to 3.2).
* **Legend:** Represents training step counts (6e18, 1e19, 3e19, 6e19, 1e20, 3e20, 6e20). Each step count is associated with a different color.
* **Horizontal Line:** A turquoise horizontal line is present at approximately 638.
**Right Plot:**
* **X-axis:** FLOPs (log scale, from 10^7 to 10^15). Markers are at approximately 10^7, 10^9, 10^11, 10^13, 10^15.
* **Y-axis:** Tokens (log scale, from 10B to 1T). Markers are at approximately 10B, 100B, 1B, 10B, 100B, 1T.
* **Diagonal Line:** A red dashed diagonal line is present.
* **Horizontal Line:** A turquoise horizontal line is present at approximately 1.4T.
### Detailed Analysis or Content Details
**Left Plot:**
* **6e18 (Green):** Starts at approximately 3.15, decreases to around 2.6, then plateaus.
* **1e19 (Light Blue):** Starts at approximately 3.0, decreases to around 2.5, then plateaus.
* **3e19 (Blue):** Starts at approximately 2.9, decreases to around 2.4, then plateaus.
* **6e19 (Dark Blue):** Starts at approximately 2.8, decreases to around 2.3, then plateaus.
* **1e20 (Purple):** Starts at approximately 2.7, decreases to around 2.2, then plateaus.
* **3e20 (Dark Purple):** Starts at approximately 2.6, decreases to around 2.1, then plateaus.
* **6e20 (Black):** Starts at approximately 2.5, decreases to around 2.0, then plateaus.
* All curves exhibit a decreasing trend in Training Loss as Parameters increase, then level off. The curves for higher step counts generally reach lower Training Loss values.
**Right Plot:**
* The data points form an approximately linear relationship.
* The line slopes upward, indicating that as FLOPs increase, the number of Tokens processed also increases.
* The data points are relatively closely clustered around the red dashed line.
* The first data point is at approximately (10^7 FLOPs, 10^10 Tokens).
* The last data point is at approximately (10^15 FLOPs, 10^12 Tokens).
### Key Observations
* The left plot demonstrates that increasing the number of parameters generally leads to lower training loss, up to a point of diminishing returns.
* The right plot shows a strong correlation between FLOPs and the number of tokens processed. The relationship appears to be roughly linear.
* The horizontal lines in both plots may represent a threshold or limit.
### Interpretation
The data suggests a scaling relationship between model size (Parameters), training effort (FLOPs), and performance (Training Loss). Increasing model size and training compute generally improves performance, but there are diminishing returns. The linear relationship between FLOPs and Tokens suggests that the computational cost of training scales predictably with the amount of data processed. The horizontal lines could indicate a saturation point where further increases in parameters or FLOPs do not yield significant improvements in training loss or token processing. The data points are relatively well-behaved, suggesting a consistent and predictable relationship between these variables. The curves in the left plot show that the training loss decreases with increasing parameters, but the rate of decrease slows down as the number of parameters increases. This suggests that there is a point of diminishing returns where adding more parameters does not significantly improve the training loss. The right plot shows that the number of tokens processed increases linearly with the number of FLOPs. This suggests that the computational cost of training is proportional to the amount of data processed.