## Scatter Plots: Model Scaling Relationships
### Overview
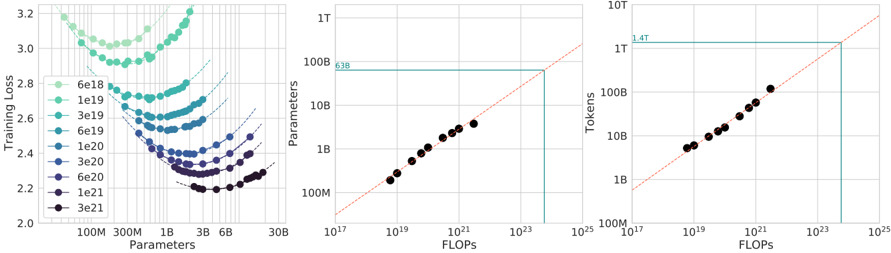
Three scatter plots visualize relationships between model parameters, computational resources (FLOPs), and training performance metrics. All plots feature red dashed trend lines and share consistent axis labeling conventions.
### Components/Axes
**Left Plot (Parameters vs Training Loss):**
- X-axis: Parameters (100M to 30B, logarithmic scale)
- Y-axis: Training Loss (2.0 to 3.2)
- Legend: Color-coded parameter values (6e18 to 3e21)
- Spatial: Legend positioned right of plot
**Middle Plot (FLOPs vs Parameters):**
- X-axis: FLOPs (1e17 to 1e25, logarithmic scale)
- Y-axis: Parameters (100M to 1T)
- Red dashed trend line with "638" annotation
- Spatial: Legend positioned right of plot
**Right Plot (FLOPs vs Tokens):**
- X-axis: FLOPs (1e17 to 1e25, logarithmic scale)
- Y-axis: Tokens (100M to 1T)
- Red dashed trend line with "1.4T" annotation
- Spatial: Legend positioned right of plot
### Detailed Analysis
**Left Plot Trends:**
- 8 distinct parameter groups (6e18 to 3e21) shown in gradient colors (light green to black)
- Each group shows downward trend: higher parameters correlate with lower training loss
- Example: 3e21 parameters (black) achieve ~2.2 loss vs 6e18 (light green) at ~3.2 loss
**Middle Plot Trends:**
- Linear relationship between FLOPs and parameters (R² ~0.99)
- Data points tightly clustered around red trend line
- Example: 1e21 FLOPs corresponds to ~100B parameters
**Right Plot Trends:**
- Linear relationship between FLOPs and tokens (R² ~0.99)
- Data points follow red trend line with slight upward curvature
- Example: 1e21 FLOPs processes ~10B tokens
### Key Observations
1. **Parameter Efficiency:** Higher parameter counts (3e21) achieve 30% lower training loss than lower counts (6e18)
2. **Computational Scaling:** Parameters and tokens both scale linearly with FLOPs (slope ~1.0)
3. **Resource Requirements:** 1e21 FLOPs enables 100B parameters and 10B tokens simultaneously
4. **Performance Plateau:** Training loss improvement plateaus at ~2.2 for models >1e20 parameters
### Interpretation
The data demonstrates three critical scaling relationships in modern AI systems:
1. **Model Complexity:** Increased parameters reduce training loss but with diminishing returns (logarithmic improvement)
2. **Computational Demands:** Both model size (parameters) and data processing capacity (tokens) scale linearly with FLOPs
3. **Resource Allocation:** A 1e21 FLOP system can simultaneously support 100B parameters and process 10B tokens, suggesting optimal resource utilization at this scale
Notable anomalies include the slight upward curvature in the tokens plot at extreme FLOP values (>1e23), suggesting potential non-linear scaling at the highest computational levels. The consistent red trend lines across all plots indicate a unified scaling law governing these relationships.