## Box Plot Grid: Angular Distance vs. Concatenation Method for Different Loss Functions
### Overview
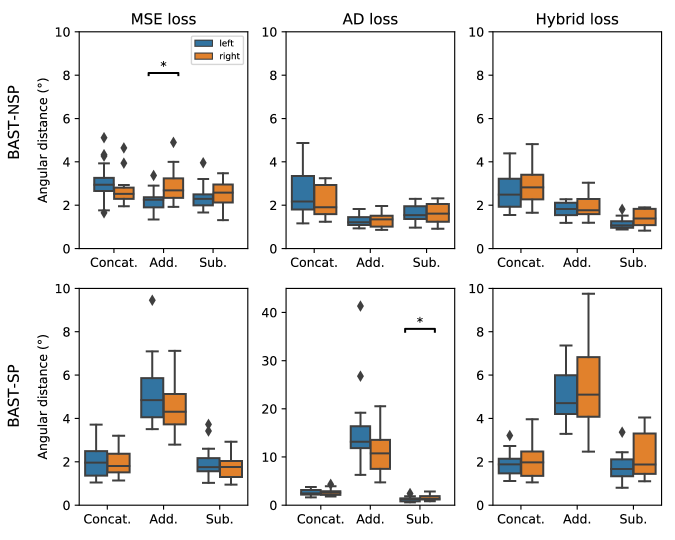
The image presents a grid of box plots comparing the angular distance for different concatenation methods (Concat., Add., Sub.) under three loss functions (MSE loss, AD loss, Hybrid loss) for two conditions ("left" and "right"). The y-axis represents the angular distance in degrees, and the x-axis represents the concatenation method. The grid is organized into two rows, representing two different BAST metrics: BAST-NSP (top row) and BAST-SP (bottom row).
### Components/Axes
* **Titles:**
* Top Row: MSE loss, AD loss, Hybrid loss
* Left Column: BAST-NSP, BAST-SP
* **Y-axis:** Angular distance (°), ranging from 0 to 10 for all plots except the bottom-middle plot, which ranges from 0 to 40.
* **X-axis:** Concatenation methods: Concat., Add., Sub.
* **Legend:** Located in the top-left plot, indicating "left" (blue) and "right" (orange).
* **Statistical Significance:** Asterisks (*) indicate statistically significant differences between "left" and "right" conditions.
### Detailed Analysis
**Top Row: BAST-NSP**
* **MSE loss:**
* "Left" (blue): The median is around 2.5° for Concat., 2.2° for Add., and 2.2° for Sub. There are outliers above 4°.
* "Right" (orange): The median is around 2.8° for Concat., 3.0° for Add., and 2.8° for Sub.
* Trend: The angular distance is relatively consistent across the different concatenation methods for both "left" and "right".
* Statistical Significance: A statistically significant difference is indicated between the "left" and "right" conditions.
* **AD loss:**
* "Left" (blue): The median is around 1.2° for Concat., 1.2° for Add., and 1.2° for Sub.
* "Right" (orange): The median is around 2.5° for Concat., 1.8° for Add., and 2.0° for Sub.
* Trend: The angular distance is relatively consistent across the different concatenation methods for both "left" and "right".
* **Hybrid loss:**
* "Left" (blue): The median is around 1.5° for Concat., 1.5° for Add., and 1.2° for Sub.
* "Right" (orange): The median is around 2.8° for Concat., 2.0° for Add., and 1.8° for Sub.
* Trend: The angular distance is relatively consistent across the different concatenation methods for both "left" and "right".
**Bottom Row: BAST-SP**
* **MSE loss:**
* "Left" (blue): The median is around 2.0° for Concat., 4.5° for Add., and 1.5° for Sub.
* "Right" (orange): The median is around 2.5° for Concat., 5.0° for Add., and 2.0° for Sub.
* Trend: The angular distance is higher for the "Add." method compared to "Concat." and "Sub." for both "left" and "right".
* **AD loss:**
* "Left" (blue): The median is around 2.0° for Concat., 15° for Add., and 1.0° for Sub.
* "Right" (orange): The median is around 2.0° for Concat., 2.0° for Add., and 1.0° for Sub.
* Trend: The angular distance is significantly higher for the "Add." method in the "left" condition compared to the "right" condition.
* Statistical Significance: A statistically significant difference is indicated between the "left" and "right" conditions.
* **Hybrid loss:**
* "Left" (blue): The median is around 1.8° for Concat., 5.0° for Add., and 1.5° for Sub.
* "Right" (orange): The median is around 2.5° for Concat., 6.0° for Add., and 2.5° for Sub.
* Trend: The angular distance is higher for the "Add." method compared to "Concat." and "Sub." for both "left" and "right".
### Key Observations
* The AD loss function generally results in lower angular distances for BAST-NSP compared to MSE and Hybrid loss.
* For BAST-SP, the "Add." concatenation method often leads to higher angular distances, particularly with MSE and Hybrid loss.
* The AD loss function shows a significant difference between "left" and "right" conditions for the "Add." concatenation method in BAST-SP.
### Interpretation
The box plots illustrate the impact of different loss functions and concatenation methods on angular distance, a measure of error or deviation. The choice of loss function and concatenation method significantly influences the performance, especially for BAST-SP. The statistical significance observed in the AD loss function for BAST-SP suggests that this combination may be particularly sensitive to differences between "left" and "right" conditions. The higher angular distances observed with the "Add." method for BAST-SP indicate that this concatenation approach may introduce more error or variability compared to "Concat." and "Sub." in certain scenarios.