# Technical Document Extraction
## Figure Components
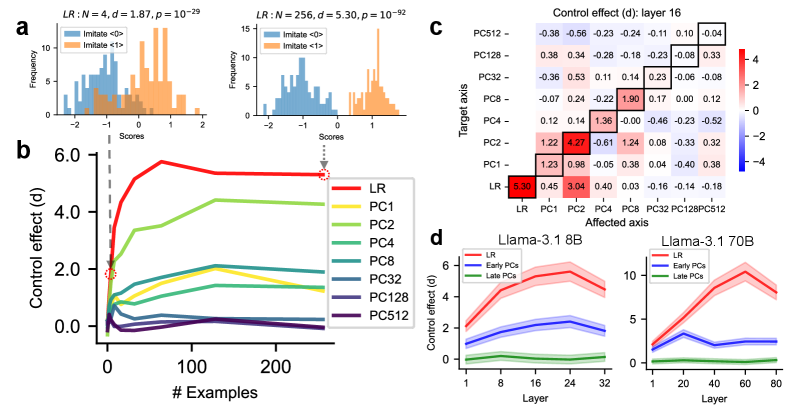
### a. Histograms of Immediate Effects
**Left Histogram (N=4, d=1.87, p=1e-29):**
- **X-axis:** Scores (-2 to 2)
- **Y-axis:** Frequency
- **Legend:**
- Blue: Immediate <->
- Orange: Immediate <1>
**Right Histogram (N=256, d=5.30, p=1e-92):**
- **X-axis:** Scores (-2 to 2)
- **Y-axis:** Frequency
- **Legend:**
- Blue: Immediate <->
- Orange: Immediate <1>
---
### b. Control Effect (d) vs. Number of Examples
**Line Graph:**
- **X-axis:** # Examples (0 to 200)
- **Y-axis:** Control Effect (d) (0 to 6)
- **Legend:**
- Red: LR
- Yellow: PC1
- Green: PC2
- Teal: PC4
- Light Blue: PC8
- Dark Blue: PC32
- Purple: PC128
- Dark Purple: PC512
**Key Observations:**
- LR (red) shows steepest initial increase, plateauing near 5.30 at 200 examples.
- PC1 (yellow) and PC2 (green) exhibit moderate growth, plateauing below 4.0.
- PC4 (teal) and PC8 (light blue) show gradual increases, plateauing near 2.0.
- PC32 (dark blue) and PC128 (purple) exhibit minimal growth, plateauing near 0.5.
- PC512 (dark purple) remains near baseline (0.0) throughout.
---
### c. Heatmap: Control Effect (d) for Layer 16
**Matrix Structure:**
- **Rows (Target Layers):** PC512, PC128, PC32, PC8, PC4, PC2, PC1, LR
- **Columns (Target Axes):** LR, PC1, PC2, PC4, PC8, PC32, PC128, PC512
- **Color Scale:** -4 (blue) to +4 (red)
**Key Values:**
| Target Layer | LR | PC1 | PC2 | PC4 | PC8 | PC32 | PC128 | PC512 |
|--------------|-------|-------|-------|-------|-------|-------|-------|-------|
| PC512 | -0.38 | -0.56 | -0.23 | -0.24 | -0.11 | 0.10 | -0.04 | |
| PC128 | 0.38 | 0.34 | -0.28 | -0.18 | -0.23 | -0.08 | 0.33 | |
| PC32 | -0.36 | 0.53 | -0.22 | -0.11 | 0.14 | 0.23 | -0.06 | -0.08 |
| PC8 | -0.07 | -0.07 | -0.11 | 1.90 | 0.17 | 0.00 | -0.08 | 0.12 |
| PC4 | 0.12 | 1.22 | 4.27 | -0.61 | 1.24 | 0.08 | -0.33 | 0.32 |
| PC2 | 1.23 | 1.98 | -0.05 | 0.38 | 0.04 | -0.40 | 0.38 | |
| PC1 | 5.30 | 0.45 | 3.04 | 0.40 | -0.16 | -0.14 | -0.18 | |
| LR | | | | | | | | |
**Notable Trends:**
- **PC4** shows strongest positive effects (e.g., 4.27 for PC2→PC4).
- **PC512** exhibits mixed effects, with negative values dominating (e.g., -0.56 for PC1→PC512).
- **LR** has moderate effects (e.g., 5.30 for PC1→LR).
---
### d. Control Effect (d) Across Layers for Llama-3.1 Models
**Left Graph (8B Parameters):**
- **X-axis:** Layer (0 to 32)
- **Y-axis:** Control Effect (d) (0 to 6)
- **Legend:**
- Blue: Early PCs
- Green: Late PCs
- Red: LR
**Right Graph (70B Parameters):**
- **X-axis:** Layer (0 to 40)
- **Y-axis:** Control Effect (d) (0 to 10)
- **Legend:**
- Blue: Early PCs
- Green: Late PCs
- Red: LR
**Key Observations:**
- **Early PCs** (blue) show gradual increases in control effect with layer depth.
- **Late PCs** (green) remain near baseline (0.0) across all layers.
- **LR** (red) demonstrates steep growth in 70B model, reaching ~5.0 by layer 40.
- **8B model** exhibits slower growth compared to 70B, with LR plateauing near 4.0.
---
### Cross-Referenced Legend Consistency
- **Part b:** LR (red) matches line color and label.
- **Part d:** Early PCs (blue) and Late PCs (green) align with line colors.
- **Part c:** Heatmap color scale (-4 to +4) matches visual gradient.