# Technical Document Extraction: Flow Length Frequency Analysis
## Image Description
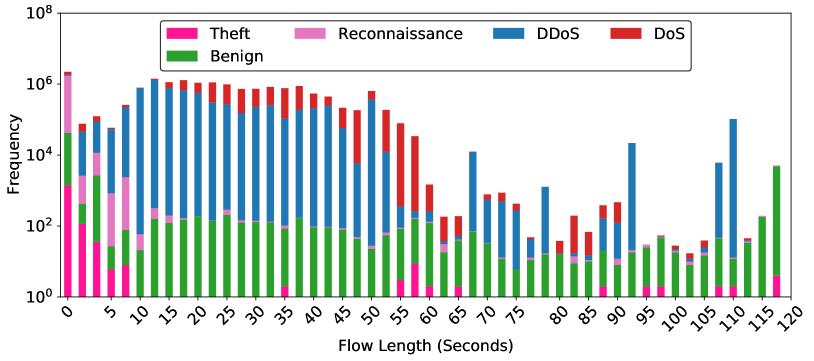
The image is a **stacked bar chart** visualizing the distribution of network flow categories across different flow lengths (in seconds). The chart uses a **logarithmic y-axis** (Frequency) and a **linear x-axis** (Flow Length). Each bar is segmented by color to represent five categories: Theft, Reconnaissance, DDoS, DoS, and Benign.
---
## Key Components
### 1. **Axis Labels and Markers**
- **X-Axis (Flow Length):**
- Title: *"Flow Length (Seconds)"*
- Range: 0 to 120 seconds (increments of 5 seconds).
- Labels: 0, 5, 10, ..., 120.
- **Y-Axis (Frequency):**
- Title: *"Frequency"*
- Scale: Logarithmic (10⁰ to 10⁸).
- Labels: 10⁰, 10², 10⁴, 10⁶, 10⁸.
### 2. **Legend**
- **Location:** Top-left corner.
- **Categories and Colors:**
- **Theft:** Pink
- **Reconnaissance:** Purple
- **DDoS:** Blue
- **DoS:** Red
- **Benign:** Green
---
## Data Trends and Observations
### 1. **Theft (Pink)**
- **Trend:** Dominates **short flow lengths (0–20 seconds)**.
- **Peak Frequency:** ~10⁶ at 0 seconds.
- **Decline:** Rapidly decreases after 20 seconds, becoming negligible beyond 40 seconds.
### 2. **Reconnaissance (Purple)**
- **Trend:** Secondary to Theft in short flows (0–20 seconds).
- **Peak Frequency:** ~10⁵ at 0 seconds.
- **Decline:** Gradual reduction after 20 seconds, fading by 40 seconds.
### 3. **DDoS (Blue)**
- **Trend:** Peaks in **mid-range flows (50–70 seconds)**.
- **Peak Frequency:** ~10⁷ at 60 seconds.
- **Distribution:** Moderate presence in shorter flows (0–40 seconds), declines after 80 seconds.
### 4. **DoS (Red)**
- **Trend:** Peaks in **mid-range flows (60–80 seconds)**.
- **Peak Frequency:** ~10⁶ at 70 seconds.
- **Distribution:** Moderate in shorter flows (0–50 seconds), declines after 90 seconds.
### 5. **Benign (Green)**
- **Trend:** Dominates **long flow lengths (100–120 seconds)**.
- **Peak Frequency:** ~10⁷ at 120 seconds.
- **Distribution:** Minimal in short flows (0–50 seconds), increases steadily after 80 seconds.
---
## Spatial Grounding and Color Verification
- **Legend Colors Match Bars:**
- Pink (Theft) segments are tallest in 0–20s.
- Blue (DDoS) segments dominate 50–70s.
- Red (DoS) segments peak at 70s.
- Green (Benign) segments grow tallest at 120s.
---
## Component Isolation
- **Main Chart:** Stacked bars with logarithmic y-axis.
- **Legend:** Top-left, no overlapping elements.
- **No Footer/Header:** Chart focuses solely on data visualization.
---
## Conclusion
The chart reveals distinct behavioral patterns for network flow categories:
- **Short flows (0–40s):** Dominated by Theft and Reconnaissance.
- **Mid-range flows (50–90s):** DDoS and DoS are most frequent.
- **Long flows (100–120s):** Benign traffic prevails.
No textual data tables or embedded diagrams are present. All information is derived from axis labels, legend, and bar segmentation.