## Line Charts: ARC-C Performance Comparison
### Overview
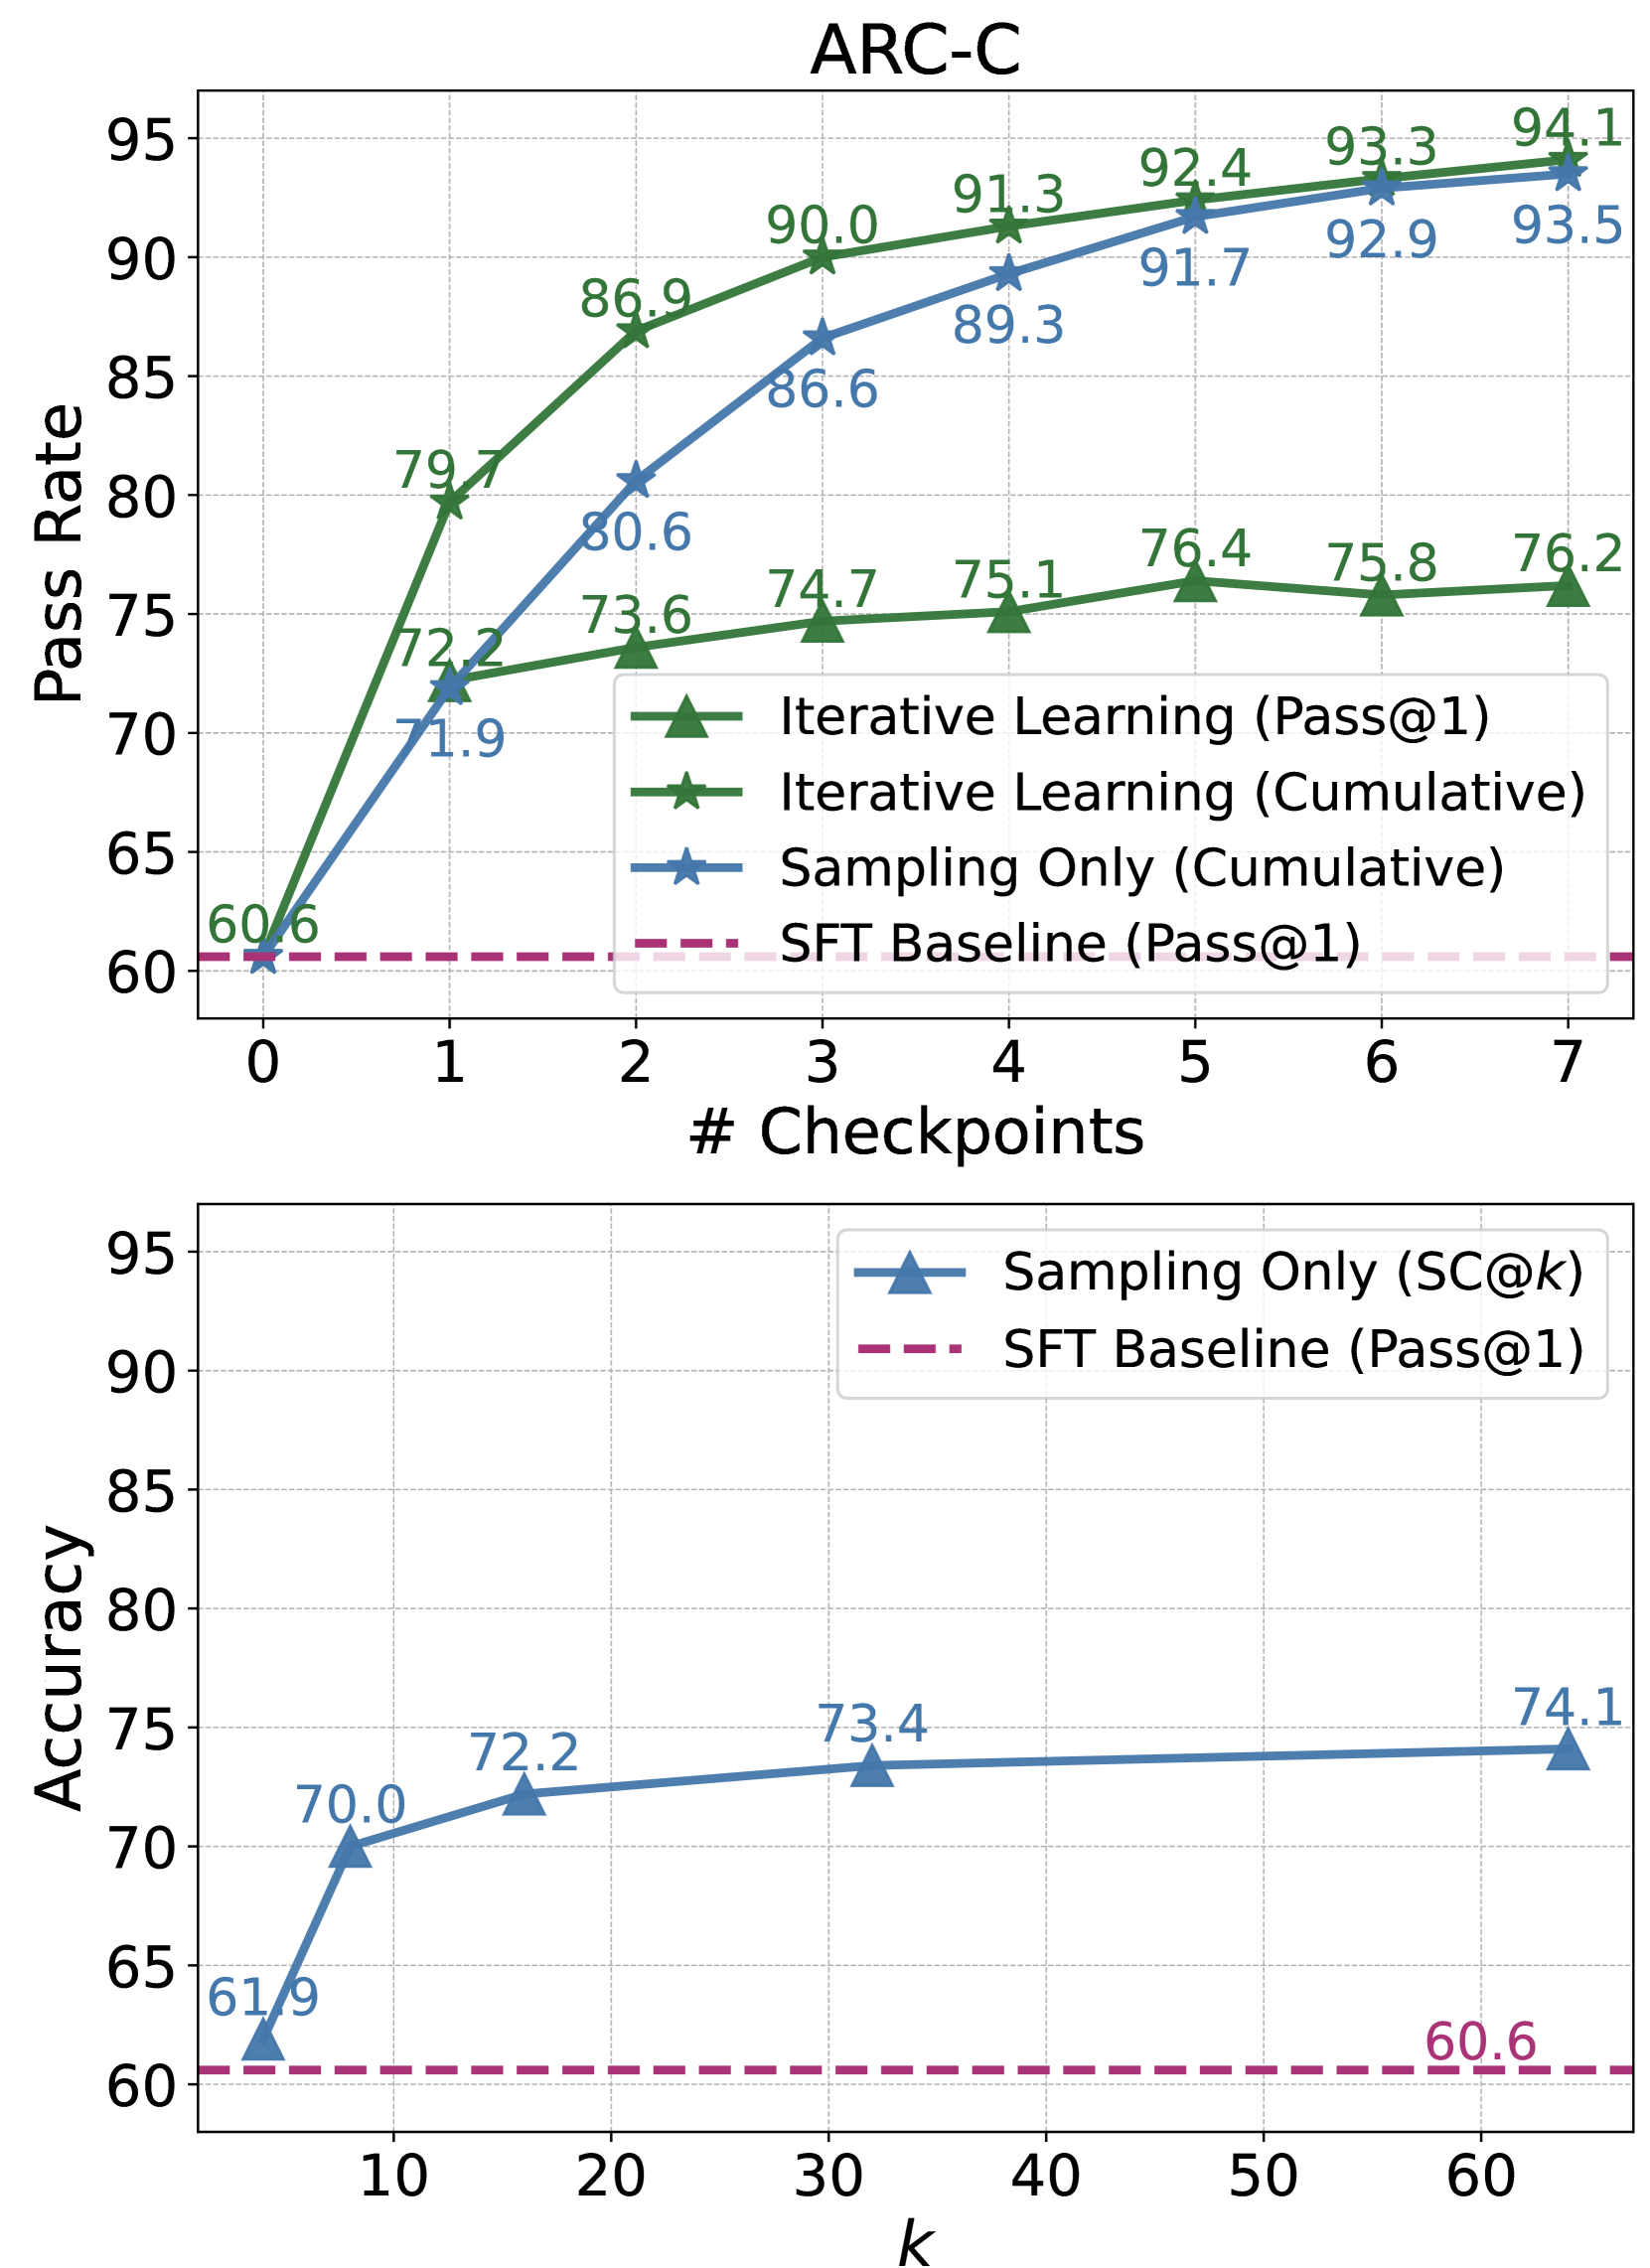
The image contains two line charts comparing the performance of different models on the ARC-C dataset. The top chart shows the "Pass Rate" as a function of "# Checkpoints" for Iterative Learning and Sampling Only methods, along with an SFT Baseline. The bottom chart shows "Accuracy" as a function of "k" for Sampling Only and the SFT Baseline.
### Components/Axes
**Top Chart:**
* **Title:** ARC-C
* **Y-axis:** Pass Rate, ranging from 60 to 95 in increments of 5.
* **X-axis:** # Checkpoints, ranging from 0 to 7 in increments of 1.
* **Legend (Top-Right):**
* Green Line with Triangle Markers: Iterative Learning (Pass@1)
* Dark Green Line with Star Markers: Iterative Learning (Cumulative)
* Blue Line with Star Markers: Sampling Only (Cumulative)
* Dashed Maroon Line: SFT Baseline (Pass@1)
**Bottom Chart:**
* **Y-axis:** Accuracy, ranging from 60 to 95 in increments of 5.
* **X-axis:** k, ranging from 10 to 60 (approximately)
* **Legend (Top-Right):**
* Blue Line with Triangle Markers: Sampling Only (SC@k)
* Dashed Maroon Line: SFT Baseline (Pass@1)
### Detailed Analysis
**Top Chart:**
* **Iterative Learning (Pass@1) - Green Triangles:** This line shows a generally increasing trend, starting at approximately 72.2 at checkpoint 1, and ending at 76.2 at checkpoint 7.
* Checkpoint 1: 72.2
* Checkpoint 2: 73.6
* Checkpoint 3: 74.7
* Checkpoint 4: 75.1
* Checkpoint 5: 76.4
* Checkpoint 6: 75.8
* Checkpoint 7: 76.2
* **Iterative Learning (Cumulative) - Dark Green Stars:** This line shows a strong upward trend, starting at approximately 79.7 at checkpoint 1, and ending at 93.5 at checkpoint 7.
* Checkpoint 0: 60.6
* Checkpoint 1: 79.7
* Checkpoint 2: 86.9
* Checkpoint 3: 90.0
* Checkpoint 4: 91.3
* Checkpoint 5: 92.4
* Checkpoint 6: 93.3
* Checkpoint 7: 93.5
* **Sampling Only (Cumulative) - Blue Stars:** This line shows an upward trend, starting at approximately 71.9 at checkpoint 1, and ending at 94.1 at checkpoint 7.
* Checkpoint 0: 60.6
* Checkpoint 1: 71.9
* Checkpoint 2: 80.6
* Checkpoint 3: 86.6
* Checkpoint 4: 89.3
* Checkpoint 5: 91.7
* Checkpoint 6: 92.9
* Checkpoint 7: 94.1
* **SFT Baseline (Pass@1) - Dashed Maroon:** This line remains constant at approximately 60.6 across all checkpoints.
**Bottom Chart:**
* **Sampling Only (SC@k) - Blue Triangles:** This line shows an increasing trend from k=5 to k=30, then plateaus.
* k = 5: 61.9
* k = 10: 70.0
* k = 20: 72.2
* k = 30: 73.4
* k = 60: 74.1
* **SFT Baseline (Pass@1) - Dashed Maroon:** This line remains constant at approximately 60.6 across all values of k.
### Key Observations
* In the top chart, Iterative Learning (Cumulative) and Sampling Only (Cumulative) significantly outperform Iterative Learning (Pass@1) and the SFT Baseline.
* The SFT Baseline consistently performs at approximately 60.6 in both charts, regardless of the number of checkpoints or the value of k.
* In the bottom chart, Sampling Only (SC@k) shows improvement as k increases from 5 to 30, but the improvement diminishes beyond that point.
### Interpretation
The data suggests that cumulative learning methods (Iterative Learning and Sampling Only) are more effective than the non-cumulative Iterative Learning (Pass@1) approach for the ARC-C dataset, as shown in the top chart. The SFT Baseline provides a consistent but lower level of performance.
The bottom chart indicates that increasing the value of 'k' in the Sampling Only (SC@k) method initially improves accuracy, but there are diminishing returns as 'k' gets larger. This suggests that there is an optimal value of 'k' beyond which further increases do not significantly enhance performance.
The consistent performance of the SFT Baseline across both charts highlights its stability but also its limitations compared to the other methods.